| Red | Green | Blue | |
| z | 17.64 | ||
| znorm | Inf | ||
| sky | -Inf | -Inf | -Inf |
| S/N | 26.1 | 46.3 | 51.2 |
| S/N(c) | 0.0 | 0.0 | 0.0 |
| SN(E/C) |
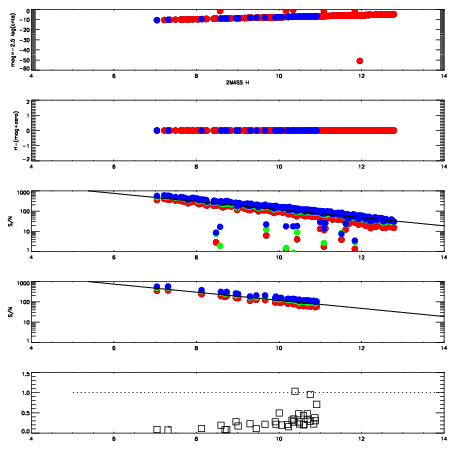
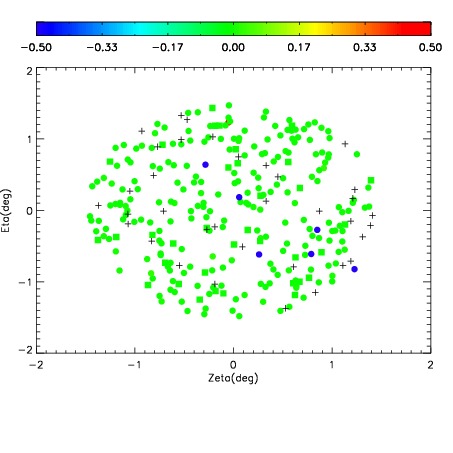
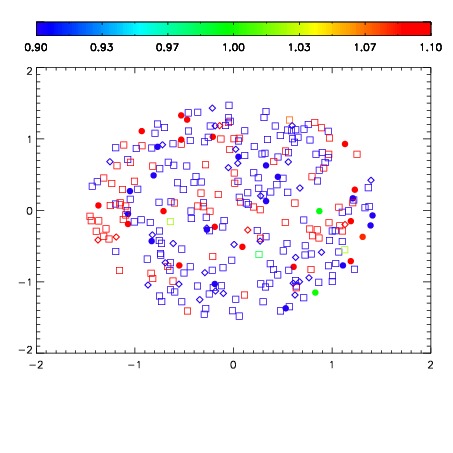
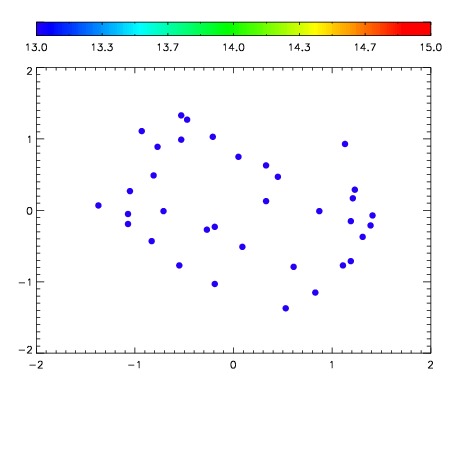

| Frame | Nreads | Zeropoints | Mag plots | Spatial mag deviation | Spatial sky 16325A emission deviations (filled: sky, open: star) | Spatial sky continuum emission | Spatial sky telluric CO2 absorption deviations (filled: H < 10) | |||||||||||||||||||||||
| 0 | 0 |
|
|
|
|
|
|
| IPAIR | NAME | SHIFT | NEWSHIFT | S/N | NAME | SHIFT | NEWSHIFT | S/N |
| 0 | 07920060 | 0.492814 | 0.00000 | 223.005 | 07920062 | -0.00267058 | 0.495485 | 217.211 |
| 1 | 07920061 | 0.492811 | 3.01003e-06 | 223.469 | 07920059 | -0.00328355 | 0.496098 | 223.239 |
| 2 | 07920057 | 0.490656 | 0.00215802 | 220.702 | 07920055 | 0.00000 | 0.492814 | 212.407 |
| 3 | 07920056 | 0.490633 | 0.00218099 | 211.970 | 07920058 | -0.00202851 | 0.494843 | 209.111 |