| Red | Green | Blue | |
| z | 17.64 | ||
| znorm | Inf | ||
| sky | -Inf | -NaN | -Inf |
| S/N | 18.1 | 32.0 | 34.0 |
| S/N(c) | 0.0 | 0.0 | 0.0 |
| SN(E/C) |
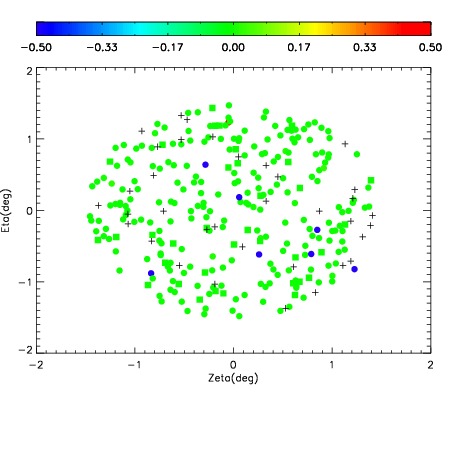
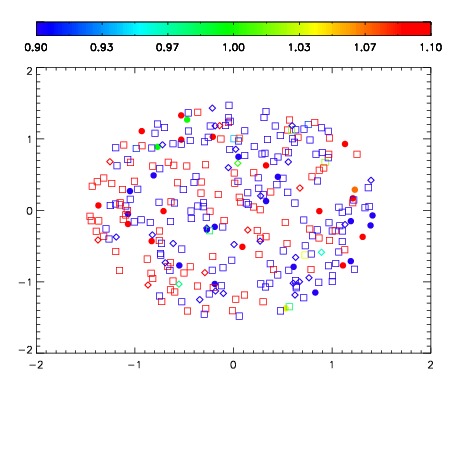
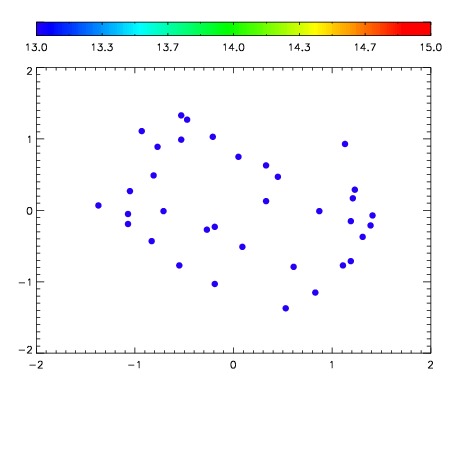

| Frame | Nreads | Zeropoints | Mag plots | Spatial mag deviation | Spatial sky 16325A emission deviations (filled: sky, open: star) | Spatial sky continuum emission | Spatial sky telluric CO2 absorption deviations (filled: H < 10) | |||||||||||||||||||||||
| 0 | 0 |
|
|
|
|
|
|
| IPAIR | NAME | SHIFT | NEWSHIFT | S/N | NAME | SHIFT | NEWSHIFT | S/N |
| 0 | 08220017 | 0.513148 | 0.00000 | 153.978 | 08220011 | 0.00000 | 0.513148 | 202.498 |
| 1 | 08220016 | 0.512247 | 0.000900984 | 214.662 | 08220018 | 0.00227090 | 0.510877 | 223.842 |
| 2 | 08220012 | 0.510556 | 0.00259203 | 146.702 | 08220014 | 0.00137781 | 0.511770 | 198.622 |
| 3 | 08220013 | 0.512140 | 0.00100803 | 128.819 | 08220015 | 4.74269e-05 | 0.513101 | 193.081 |