| Red | Green | Blue | |
| z | 17.64 | ||
| znorm | Inf | ||
| sky | -Inf | -Inf | -Inf |
| S/N | 22.4 | 38.1 | 43.7 |
| S/N(c) | 0.0 | 0.0 | 0.0 |
| SN(E/C) |

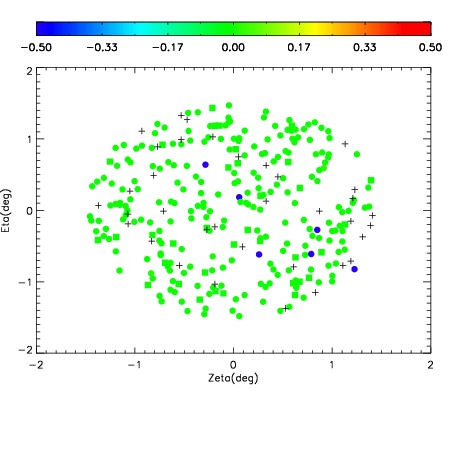
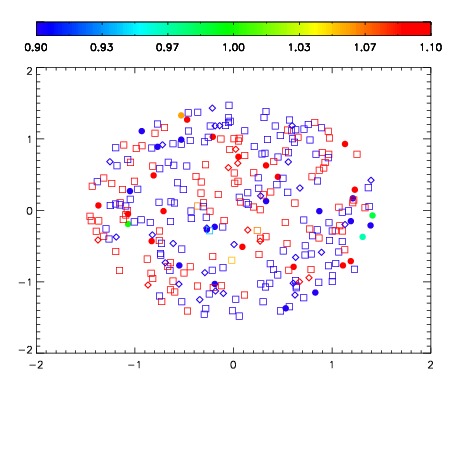
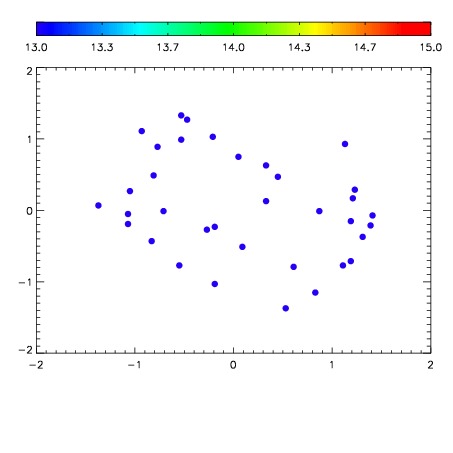

| Frame | Nreads | Zeropoints | Mag plots | Spatial mag deviation | Spatial sky 16325A emission deviations (filled: sky, open: star) | Spatial sky continuum emission | Spatial sky telluric CO2 absorption deviations (filled: H < 10) | |||||||||||||||||||||||
| 0 | 0 |
|
|
|
|
|
|
| IPAIR | NAME | SHIFT | NEWSHIFT | S/N | NAME | SHIFT | NEWSHIFT | S/N |
| 0 | 08460078 | 0.486707 | 0.00000 | 192.450 | 08460079 | 0.00420351 | 0.482504 | 195.511 |
| 1 | 08460082 | 0.486486 | 0.000221014 | 192.564 | 08460076 | 0.00000 | 0.486707 | 196.380 |
| 2 | 08460077 | 0.485070 | 0.00163701 | 188.307 | 08460080 | 0.00405524 | 0.482652 | 189.795 |
| 3 | 08460081 | 0.483941 | 0.00276601 | 186.938 | 08460083 | 0.00462688 | 0.482080 | 189.167 |