| Red | Green | Blue | |
| z | 17.64 | ||
| znorm | Inf | ||
| sky | -Inf | -Inf | -Inf |
| S/N | 24.7 | 45.4 | 52.6 |
| S/N(c) | 0.0 | 0.0 | 0.0 |
| SN(E/C) |
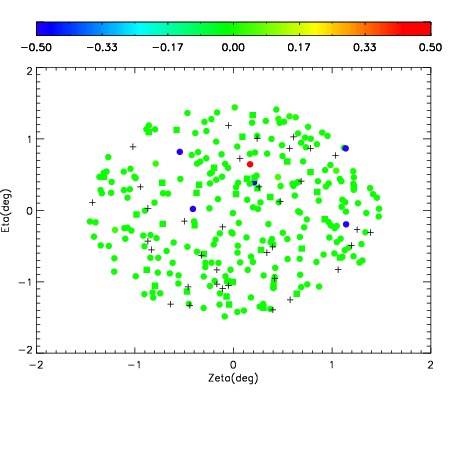
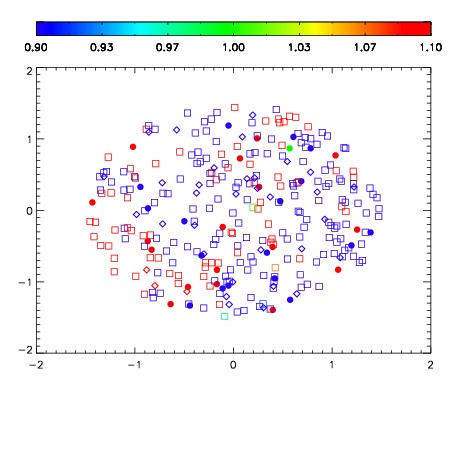
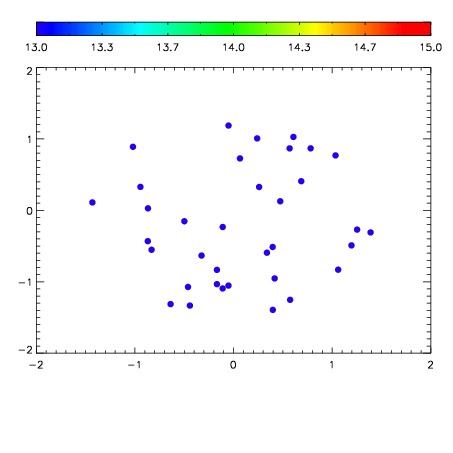

| Frame | Nreads | Zeropoints | Mag plots | Spatial mag deviation | Spatial sky 16325A emission deviations (filled: sky, open: star) | Spatial sky continuum emission | Spatial sky telluric CO2 absorption deviations (filled: H < 10) | |||||||||||||||||||||||
| 0 | 0 |
|
|
|
|
|
|
| IPAIR | NAME | SHIFT | NEWSHIFT | S/N | NAME | SHIFT | NEWSHIFT | S/N |
| 0 | 07610079 | 0.491439 | 0.00000 | 206.149 | 07610074 | 0.00505574 | 0.486383 | 213.759 |
| 1 | 07610076 | 0.483104 | 0.00833502 | 215.336 | 07610077 | 0.00202373 | 0.489415 | 219.264 |
| 2 | 07610071 | 0.483412 | 0.00802702 | 209.676 | 07610078 | 0.00826682 | 0.483172 | 216.710 |
| 3 | 07610075 | 0.482829 | 0.00861001 | 205.341 | 07610073 | 0.00339685 | 0.488042 | 203.966 |
| 4 | 07610072 | 0.484323 | 0.00711602 | 200.552 | 07610070 | 0.00000 | 0.491439 | 202.875 |