| Red | Green | Blue | |
| z | 17.64 | ||
| znorm | Inf | ||
| sky | -NaN | -Inf | -Inf |
| S/N | 24.6 | 43.5 | 48.4 |
| S/N(c) | 0.0 | 0.0 | 0.0 |
| SN(E/C) |

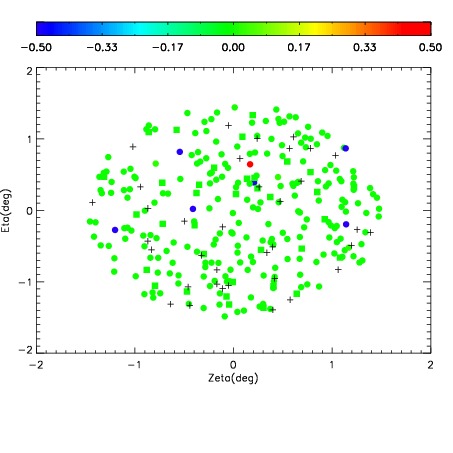
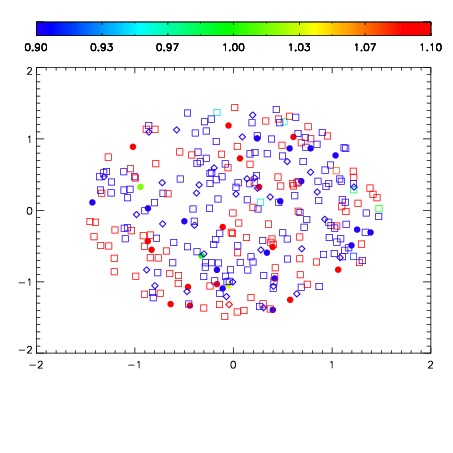
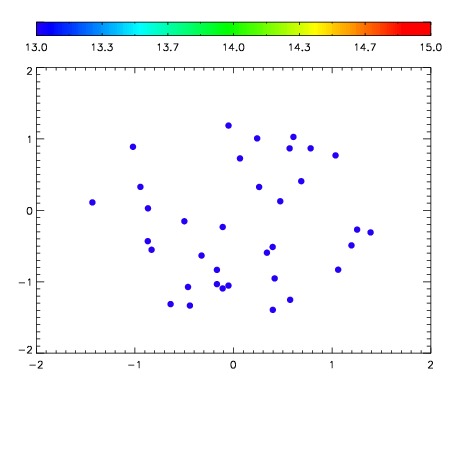

| Frame | Nreads | Zeropoints | Mag plots | Spatial mag deviation | Spatial sky 16325A emission deviations (filled: sky, open: star) | Spatial sky continuum emission | Spatial sky telluric CO2 absorption deviations (filled: H < 10) | |||||||||||||||||||||||
| 0 | 0 |
|
|
|
|
|
|
| IPAIR | NAME | SHIFT | NEWSHIFT | S/N | NAME | SHIFT | NEWSHIFT | S/N |
| 0 | 07890078 | 0.466340 | 0.00000 | 239.664 | 07890076 | -0.00123315 | 0.467573 | 236.633 |
| 1 | 07890077 | 0.465299 | 0.00104100 | 241.351 | 07890079 | 2.98334e-05 | 0.466310 | 241.044 |
| 2 | 07890074 | 0.465140 | 0.00119999 | 230.518 | 07890075 | 3.28758e-05 | 0.466307 | 229.033 |
| 3 | 07890073 | 0.464422 | 0.00191802 | 226.369 | 07890072 | 0.00000 | 0.466340 | 223.459 |