| Red | Green | Blue | |
| z | 17.64 | ||
| znorm | Inf | ||
| sky | -Inf | -Inf | -Inf |
| S/N | 22.8 | 41.0 | 45.3 |
| S/N(c) | 0.0 | 0.0 | 0.0 |
| SN(E/C) |
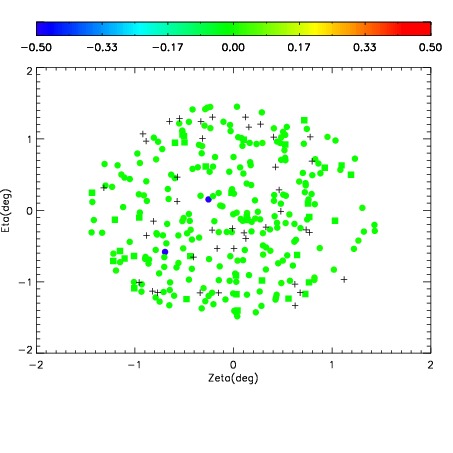
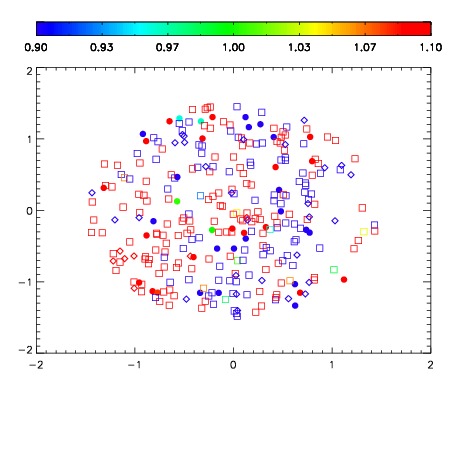
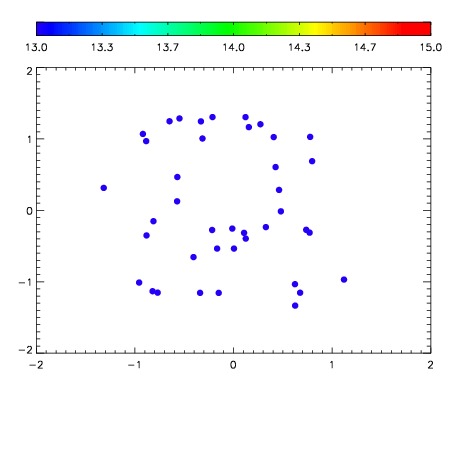

| Frame | Nreads | Zeropoints | Mag plots | Spatial mag deviation | Spatial sky 16325A emission deviations (filled: sky, open: star) | Spatial sky continuum emission | Spatial sky telluric CO2 absorption deviations (filled: H < 10) | |||||||||||||||||||||||
| 0 | 0 |
|
|
|
|
|
|
| IPAIR | NAME | SHIFT | NEWSHIFT | S/N | NAME | SHIFT | NEWSHIFT | S/N |
| 0 | 07610039 | 0.487183 | 0.00000 | 208.536 | 07610040 | 3.08476e-05 | 0.487152 | 217.026 |
| 1 | 07610042 | 0.485319 | 0.00186402 | 214.072 | 07610044 | 0.00104738 | 0.486136 | 226.145 |
| 2 | 07610043 | 0.485637 | 0.00154600 | 207.202 | 07610037 | 0.00000 | 0.487183 | 204.892 |
| 3 | 07610038 | 0.486418 | 0.000764996 | 205.863 | 07610041 | 0.00377640 | 0.483407 | 196.290 |