| Red | Green | Blue | |
| z | 17.64 | ||
| znorm | Inf | ||
| sky | -Inf | -Inf | -Inf |
| S/N | 25.9 | 45.0 | 50.9 |
| S/N(c) | 0.0 | 0.0 | 0.0 |
| SN(E/C) |

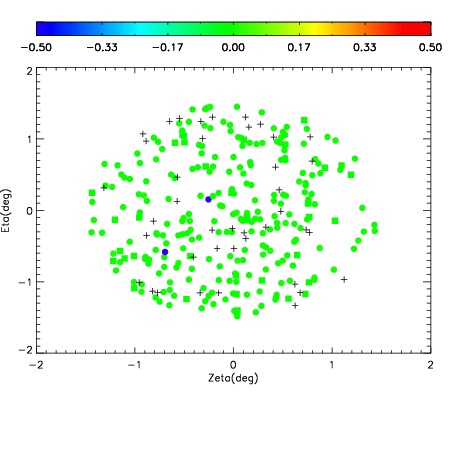
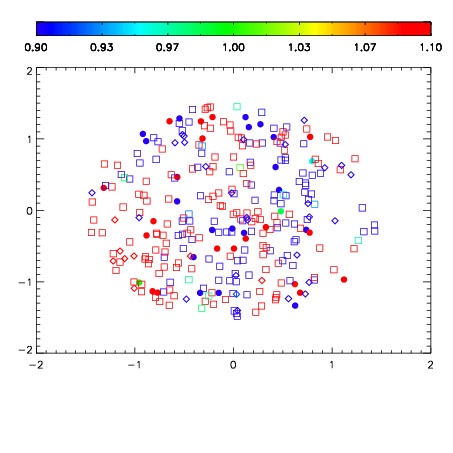


| Frame | Nreads | Zeropoints | Mag plots | Spatial mag deviation | Spatial sky 16325A emission deviations (filled: sky, open: star) | Spatial sky continuum emission | Spatial sky telluric CO2 absorption deviations (filled: H < 10) | |||||||||||||||||||||||
| 0 | 0 |
|
|
|
|
|
|
| IPAIR | NAME | SHIFT | NEWSHIFT | S/N | NAME | SHIFT | NEWSHIFT | S/N |
| 0 | 07870054 | 0.468944 | 0.00000 | 212.148 | 07870053 | 0.00000 | 0.468944 | 228.364 |
| 1 | 07870059 | 0.467581 | 0.00136301 | 237.474 | 07870060 | -0.000508858 | 0.469453 | 238.672 |
| 2 | 07870058 | 0.466520 | 0.00242400 | 235.762 | 07870057 | -0.00313583 | 0.472080 | 235.501 |
| 3 | 07870055 | 0.468425 | 0.000519007 | 233.845 | 07870056 | -0.00114716 | 0.470091 | 231.599 |