| Red | Green | Blue | |
| z | 17.64 | ||
| znorm | Inf | ||
| sky | -Inf | -Inf | -Inf |
| S/N | 27.6 | 44.2 | 47.9 |
| S/N(c) | 0.0 | 0.0 | 0.0 |
| SN(E/C) |

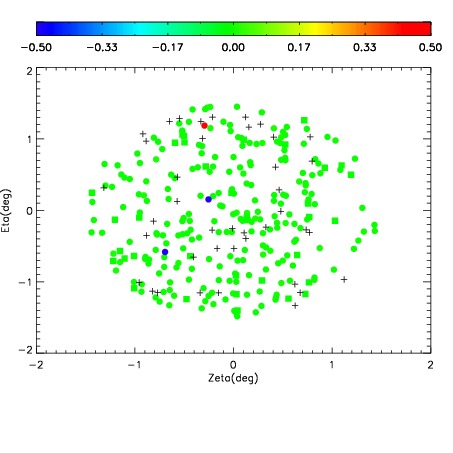


| Frame | Nreads | Zeropoints | Mag plots | Spatial mag deviation | Spatial sky 16325A emission deviations (filled: sky, open: star) | Spatial sky continuum emission | Spatial sky telluric CO2 absorption deviations (filled: H < 10) | |||||||||||||||||||||||
| 0 | 0 |
|
|
|
|
|
|
| IPAIR | NAME | SHIFT | NEWSHIFT | S/N | NAME | SHIFT | NEWSHIFT | S/N |
| 0 | 07910018 | 0.512253 | 0.00000 | 241.952 | 07910019 | 0.00782882 | 0.504424 | 243.963 |
| 1 | 07910014 | 0.509769 | 0.00248396 | 244.677 | 07910016 | 0.00490927 | 0.507344 | 246.009 |
| 2 | 07910013 | 0.509085 | 0.00316799 | 241.806 | 07910015 | 0.00495338 | 0.507300 | 241.054 |
| 3 | 07910017 | 0.510439 | 0.00181401 | 241.245 | 07910012 | 0.00000 | 0.512253 | 238.272 |