| Red | Green | Blue | |
| z | 17.64 | ||
| znorm | Inf | ||
| sky | -Inf | -Inf | -Inf |
| S/N | 22.7 | 39.1 | 43.2 |
| S/N(c) | 0.0 | 0.0 | 0.0 |
| SN(E/C) |
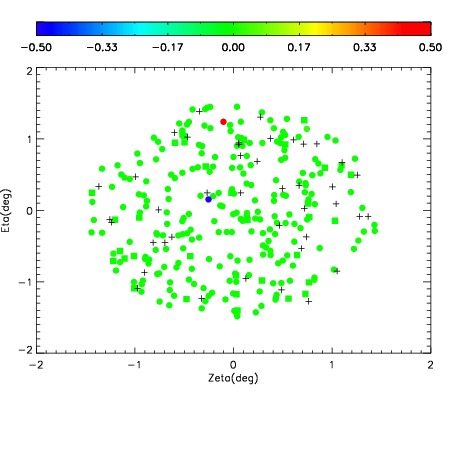

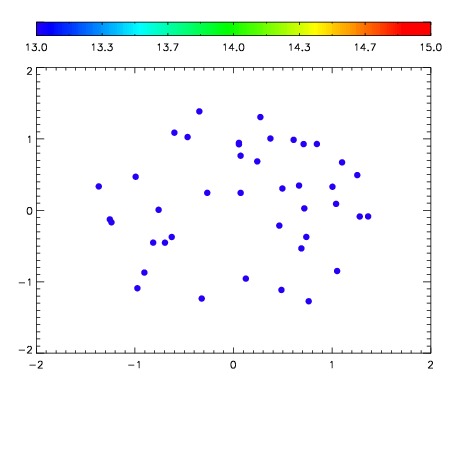

| Frame | Nreads | Zeropoints | Mag plots | Spatial mag deviation | Spatial sky 16325A emission deviations (filled: sky, open: star) | Spatial sky continuum emission | Spatial sky telluric CO2 absorption deviations (filled: H < 10) | |||||||||||||||||||||||
| 0 | 0 |
|
|
|
|
|
|
| IPAIR | NAME | SHIFT | NEWSHIFT | S/N | NAME | SHIFT | NEWSHIFT | S/N |
| 0 | 07620017 | 0.484779 | 0.00000 | 156.569 | 07620018 | 0.000235761 | 0.484543 | 152.102 |
| 1 | 07620012 | 0.481326 | 0.00345299 | 165.500 | 07620011 | 0.00000 | 0.484779 | 166.844 |
| 2 | 07620016 | 0.484195 | 0.000584006 | 158.348 | 07620015 | -0.00195409 | 0.486733 | 155.398 |
| 3 | 07620013 | 0.483331 | 0.00144801 | 139.184 | 07620014 | 6.72126e-05 | 0.484712 | 146.565 |