| Red | Green | Blue | |
| z | 17.64 | ||
| znorm | Inf | ||
| sky | -Inf | -Inf | -Inf |
| S/N | 23.8 | 37.8 | 45.8 |
| S/N(c) | 0.0 | 0.0 | 0.0 |
| SN(E/C) |
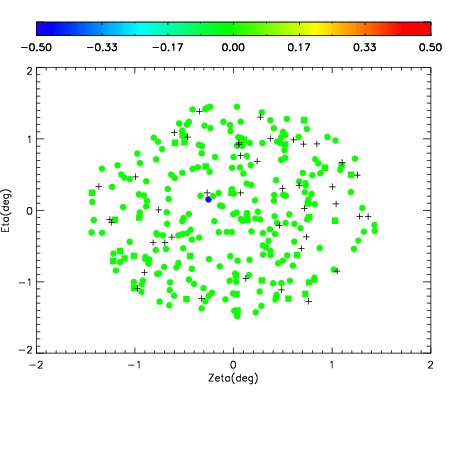
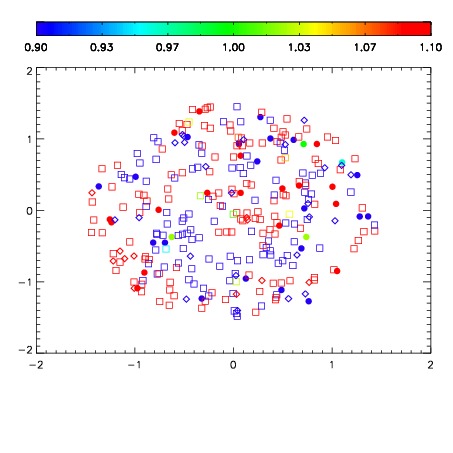
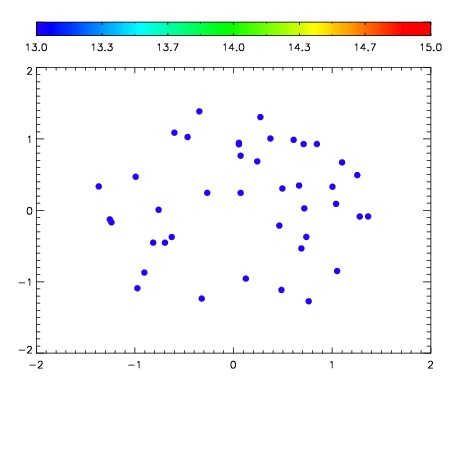

| Frame | Nreads | Zeropoints | Mag plots | Spatial mag deviation | Spatial sky 16325A emission deviations (filled: sky, open: star) | Spatial sky continuum emission | Spatial sky telluric CO2 absorption deviations (filled: H < 10) | |||||||||||||||||||||||
| 0 | 0 |
|
|
|
|
|
|
| IPAIR | NAME | SHIFT | NEWSHIFT | S/N | NAME | SHIFT | NEWSHIFT | S/N |
| 0 | 07900032 | 0.472230 | 0.00000 | 149.089 | 07900029 | 0.00197759 | 0.470252 | 184.754 |
| 1 | 07900028 | 0.471693 | 0.000536978 | 181.325 | 07900030 | -0.000120293 | 0.472350 | 189.209 |
| 2 | 07900027 | 0.470973 | 0.00125697 | 176.432 | 07900026 | 0.00000 | 0.472230 | 186.699 |
| 3 | 07900031 | 0.472014 | 0.000215977 | 148.559 | 07900033 | 4.63596e-05 | 0.472184 | 172.632 |