| Red | Green | Blue | |
| z | 17.64 | ||
| znorm | Inf | ||
| sky | -Inf | -Inf | -Inf |
| S/N | 22.6 | 35.3 | 41.9 |
| S/N(c) | 0.0 | 0.0 | 0.0 |
| SN(E/C) |

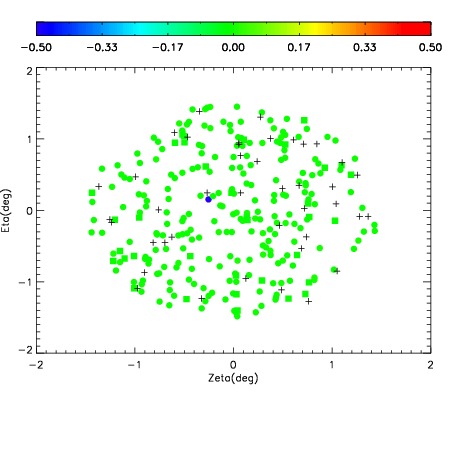
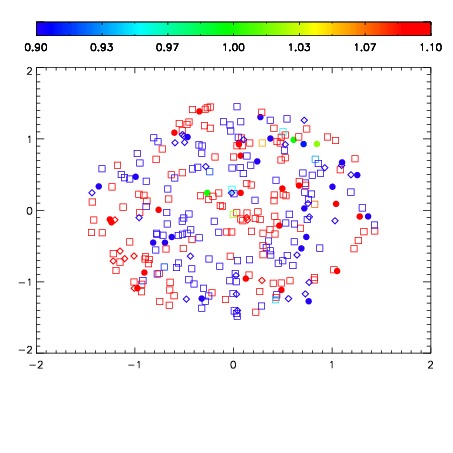
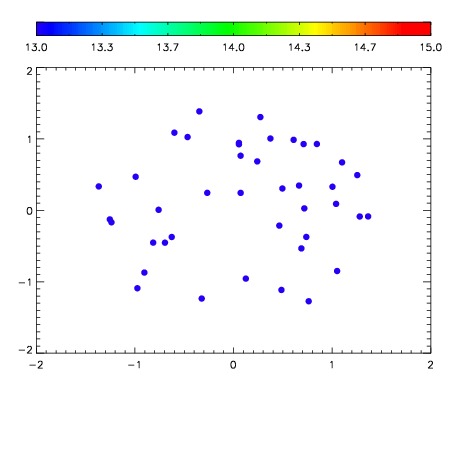

| Frame | Nreads | Zeropoints | Mag plots | Spatial mag deviation | Spatial sky 16325A emission deviations (filled: sky, open: star) | Spatial sky continuum emission | Spatial sky telluric CO2 absorption deviations (filled: H < 10) | |||||||||||||||||||||||
| 0 | 0 |
|
|
|
|
|
|
| IPAIR | NAME | SHIFT | NEWSHIFT | S/N | NAME | SHIFT | NEWSHIFT | S/N |
| 0 | 08100032 | 0.522126 | 0.00000 | 58.3867 | 08100033 | -0.000714529 | 0.522841 | 97.7076 |
| 1 | 08100028 | 0.520074 | 0.00205201 | 198.070 | 08100029 | -0.00197448 | 0.524100 | 189.743 |
| 2 | 08100027 | 0.516403 | 0.00572300 | 191.672 | 08100026 | 0.00000 | 0.522126 | 183.391 |
| 3 | 08100031 | 0.514492 | 0.00763404 | 155.700 | 08100030 | -0.00252324 | 0.524649 | 178.305 |