| Red | Green | Blue | |
| z | 17.64 | ||
| znorm | Inf | ||
| sky | -Inf | -Inf | -Inf |
| S/N | 22.6 | 38.5 | 40.5 |
| S/N(c) | 0.0 | 0.0 | 0.0 |
| SN(E/C) |
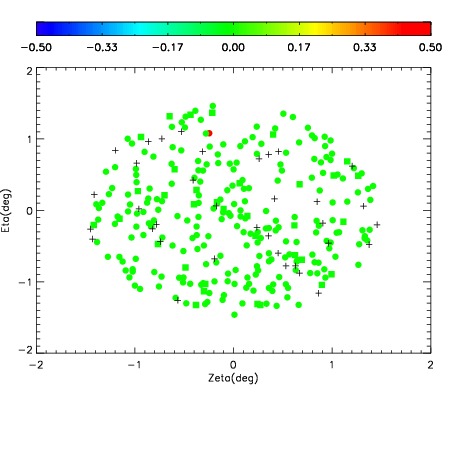
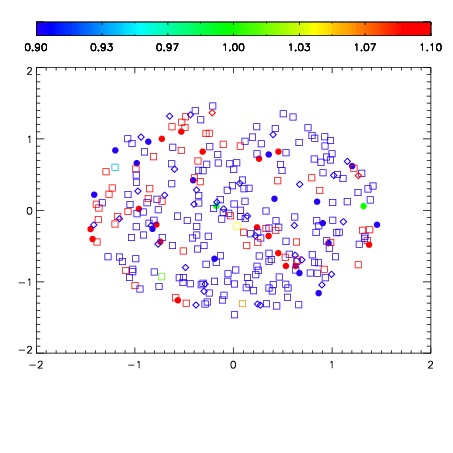
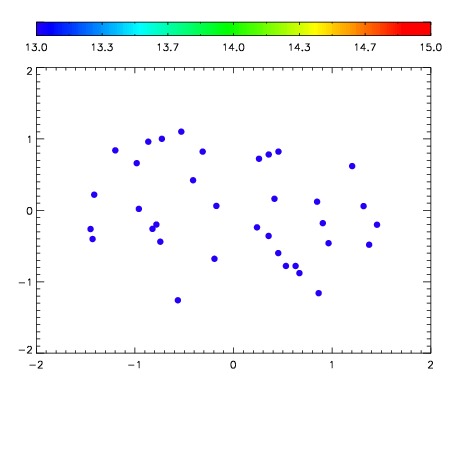

| Frame | Nreads | Zeropoints | Mag plots | Spatial mag deviation | Spatial sky 16325A emission deviations (filled: sky, open: star) | Spatial sky continuum emission | Spatial sky telluric CO2 absorption deviations (filled: H < 10) | |||||||||||||||||||||||
| 0 | 0 |
|
|
|
|
|
|
| IPAIR | NAME | SHIFT | NEWSHIFT | S/N | NAME | SHIFT | NEWSHIFT | S/N |
| 0 | 07960155 | 0.494494 | 0.00000 | 167.921 | 07960157 | 0.000412450 | 0.494082 | 166.320 |
| 1 | 07960154 | 0.493293 | 0.00120100 | 166.829 | 07960156 | 0.00109159 | 0.493402 | 165.755 |
| 2 | 07960158 | 0.494090 | 0.000404000 | 161.701 | 07960153 | 0.00000 | 0.494494 | 165.733 |