| Red | Green | Blue | |
| z | 17.64 | ||
| znorm | Inf | ||
| sky | -NaN | -Inf | -Inf |
| S/N | 9.2 | 16.9 | 19.5 |
| S/N(c) | 0.0 | 0.0 | 0.0 |
| SN(E/C) |
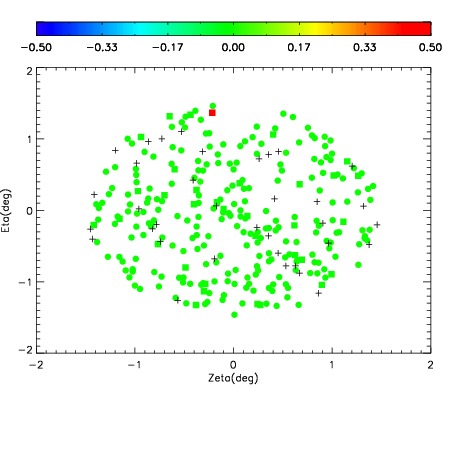
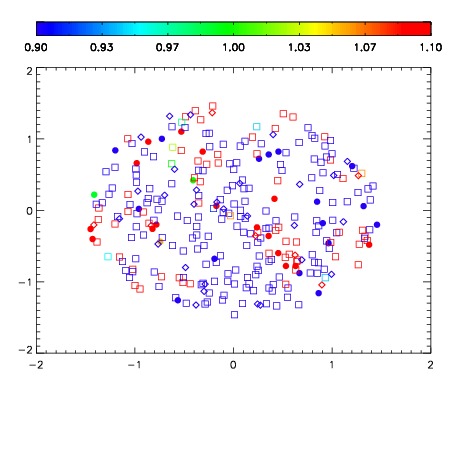
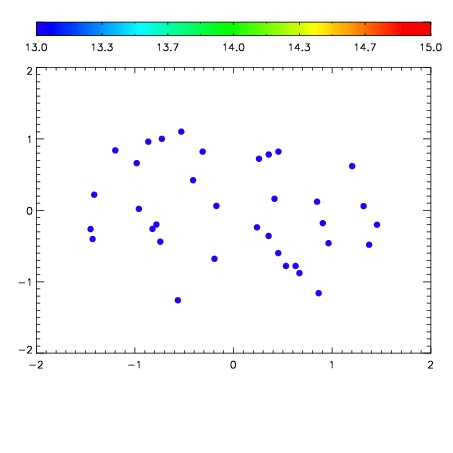

| Frame | Nreads | Zeropoints | Mag plots | Spatial mag deviation | Spatial sky 16325A emission deviations (filled: sky, open: star) | Spatial sky continuum emission | Spatial sky telluric CO2 absorption deviations (filled: H < 10) | |||||||||||||||||||||||
| 0 | 0 |
|
|
|
|
|
|
| IPAIR | NAME | SHIFT | NEWSHIFT | S/N | NAME | SHIFT | NEWSHIFT | S/N |
| 0 | 09060027 | 0.486923 | 0.00000 | 71.4814 | 09060026 | 0.00297034 | 0.483953 | 112.301 |
| 1 | 09060023 | 0.480771 | 0.00615200 | 118.704 | 09060022 | 0.00000 | 0.486923 | 151.207 |
| 2 | 09060028 | 0.486359 | 0.000564009 | 61.5061 | 09060025 | 0.00540689 | 0.481516 | 42.3095 |
| 3 | 09060024 | 0.485471 | 0.00145200 | 47.0311 | 09060029 | 0.00977149 | 0.477152 | 34.8039 |