| Red | Green | Blue | |
| z | 17.64 | ||
| znorm | Inf | ||
| sky | -Inf | -Inf | -Inf |
| S/N | 27.2 | 46.3 | 48.7 |
| S/N(c) | 0.0 | 0.0 | 0.0 |
| SN(E/C) |
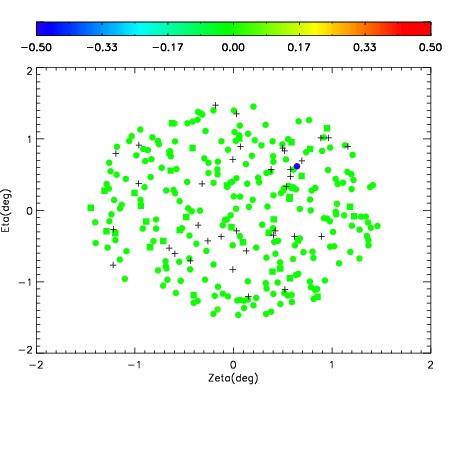
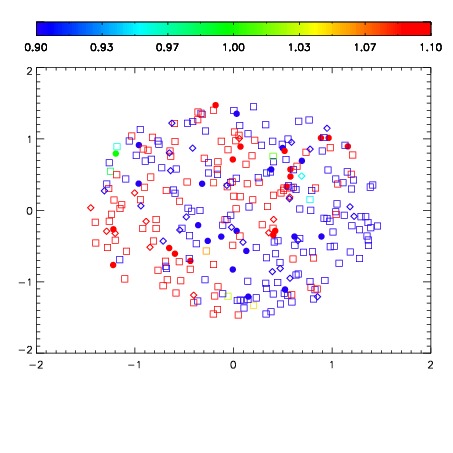
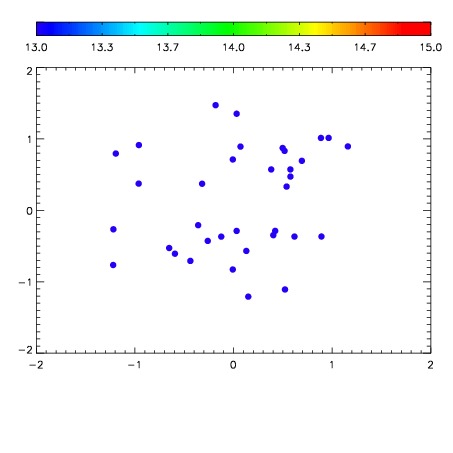

| Frame | Nreads | Zeropoints | Mag plots | Spatial mag deviation | Spatial sky 16325A emission deviations (filled: sky, open: star) | Spatial sky continuum emission | Spatial sky telluric CO2 absorption deviations (filled: H < 10) | |||||||||||||||||||||||
| 0 | 0 |
|
|
|
|
|
|
| IPAIR | NAME | SHIFT | NEWSHIFT | S/N | NAME | SHIFT | NEWSHIFT | S/N |
| 0 | 09070016 | 0.484028 | 0.00000 | 201.984 | 09070010 | 0.00000 | 0.484028 | 200.317 |
| 1 | 09070015 | 0.483461 | 0.000567019 | 207.076 | 09070014 | 0.000339383 | 0.483689 | 209.676 |
| 2 | 09070012 | 0.482310 | 0.00171801 | 206.377 | 09070013 | 0.000912104 | 0.483116 | 206.912 |
| 3 | 09070011 | 0.482539 | 0.00148901 | 204.548 | 09070017 | 0.000271321 | 0.483757 | 203.823 |