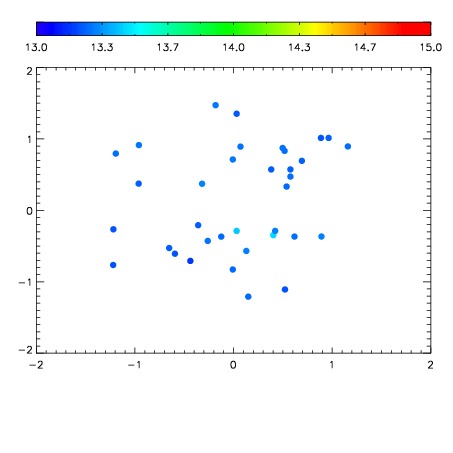
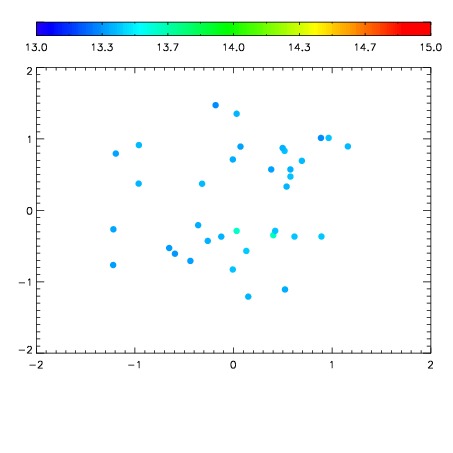
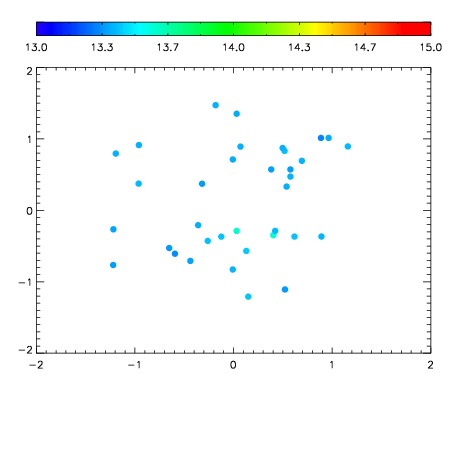
| Frame | Nreads | Zeropoints | Mag plots
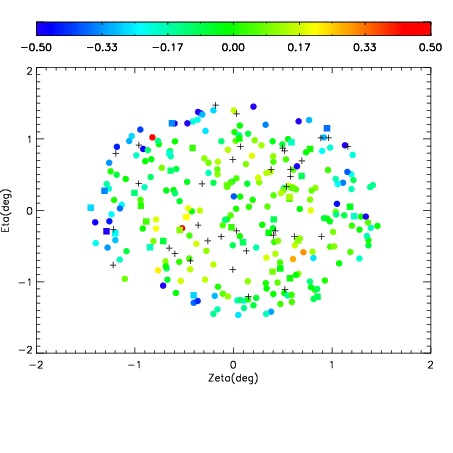
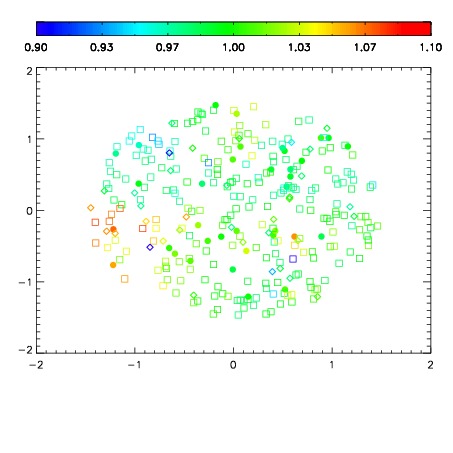
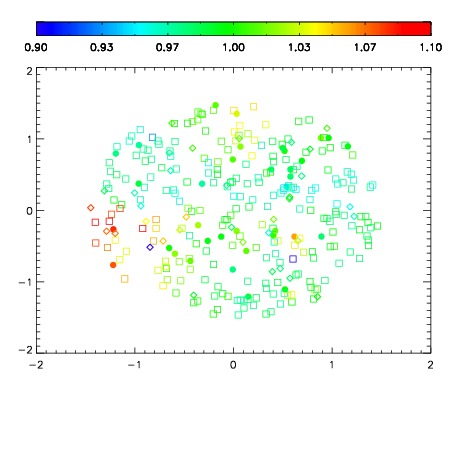
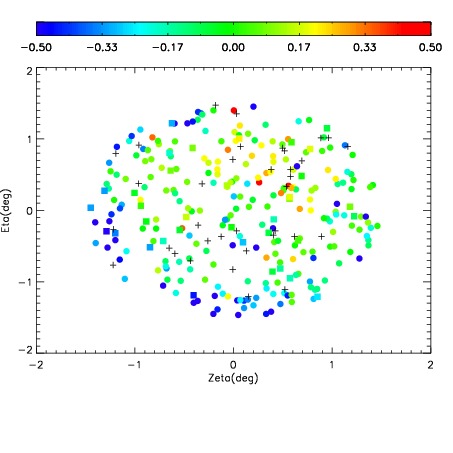
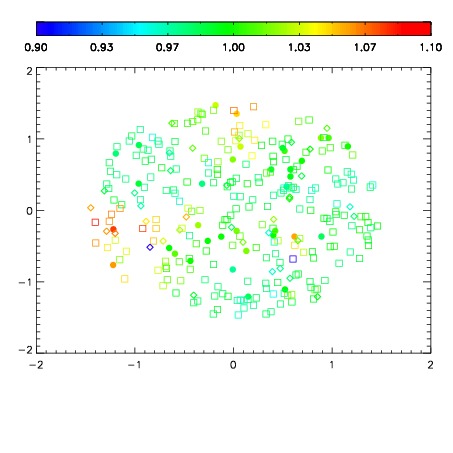
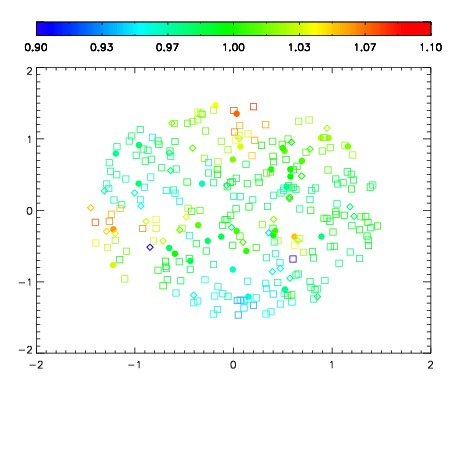
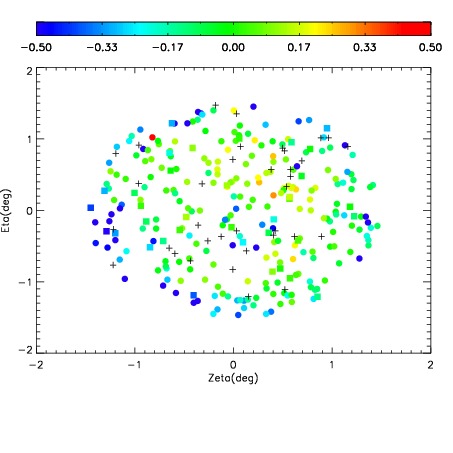
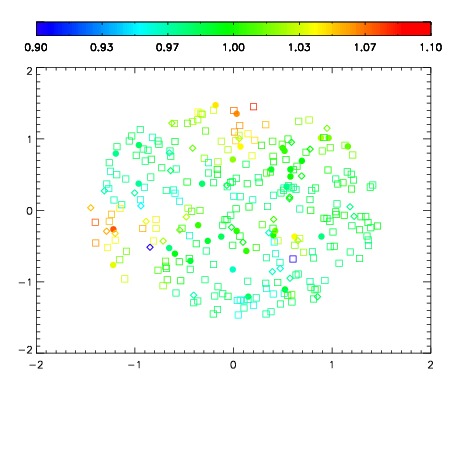
| Spatial mag deviation
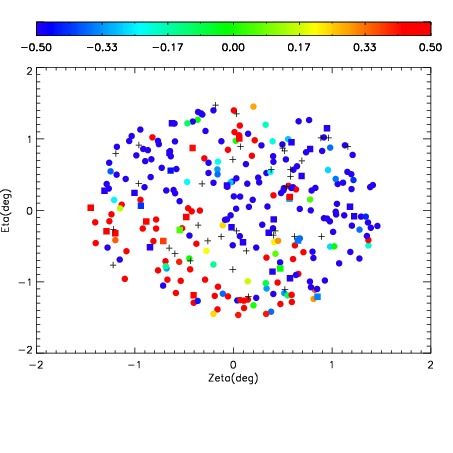
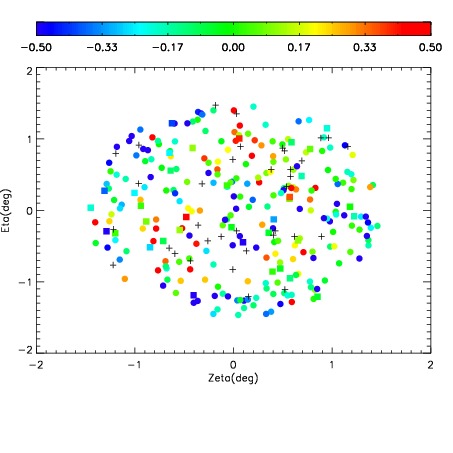
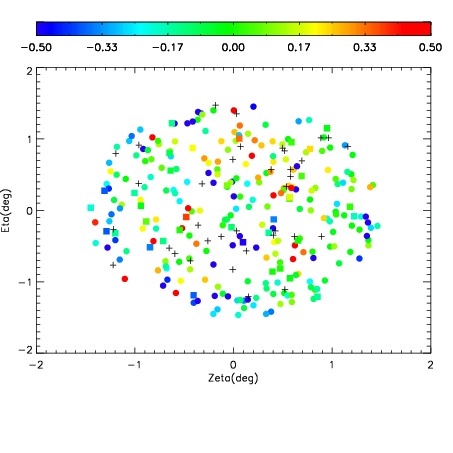
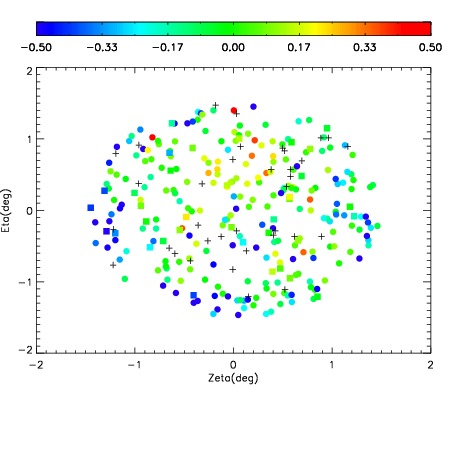
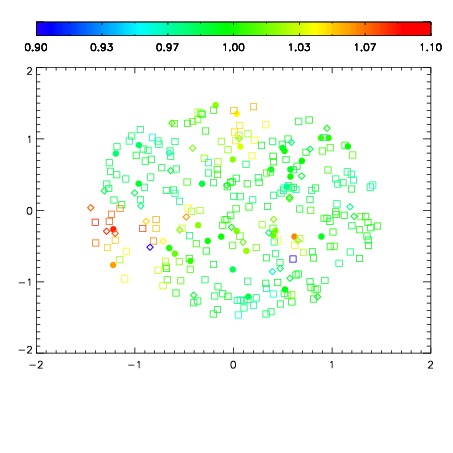
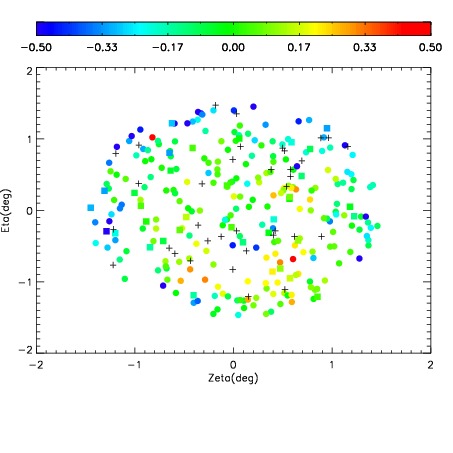
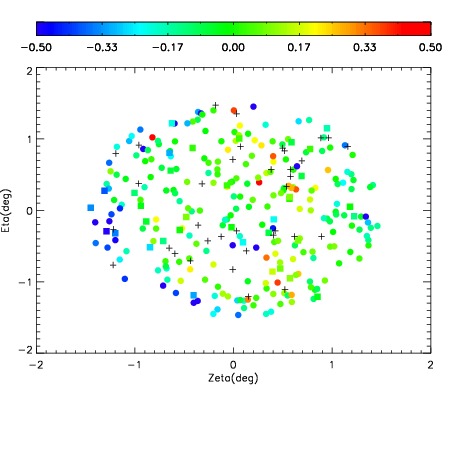
| Spatial sky 16325A emission deviations (filled: sky, open: star)
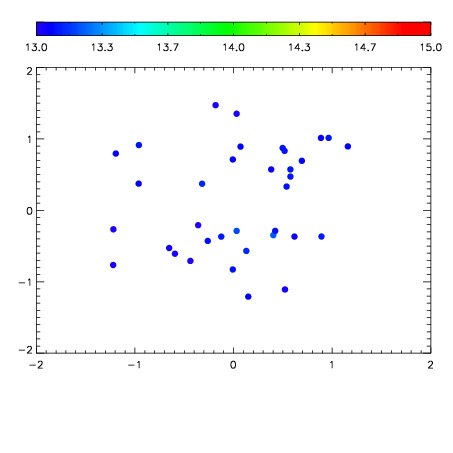
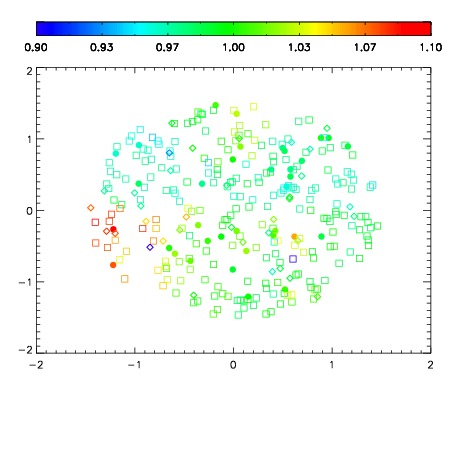
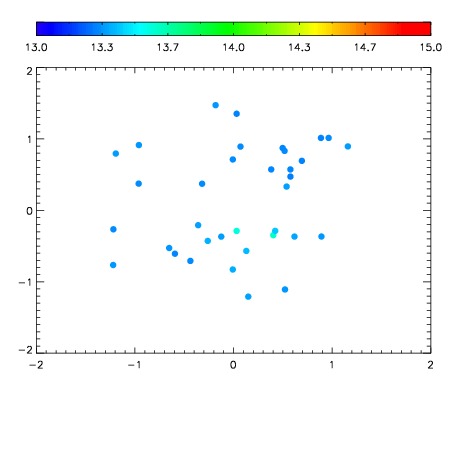
| Spatial sky continuum emission
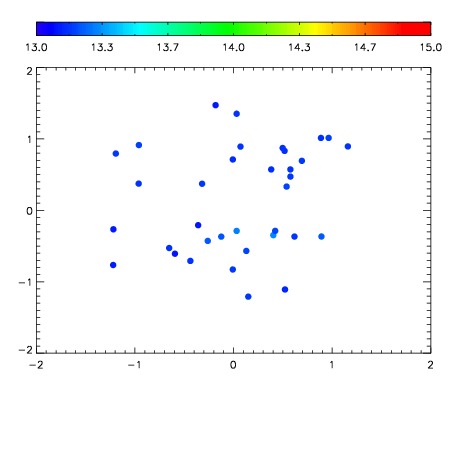
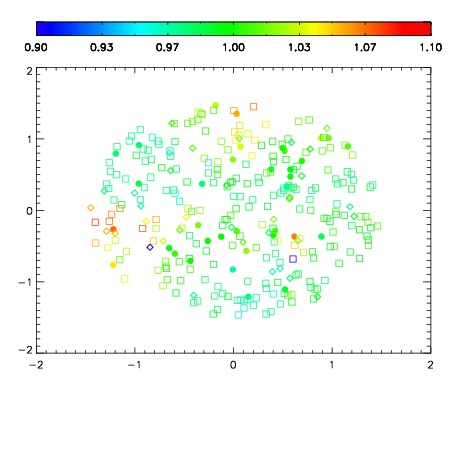
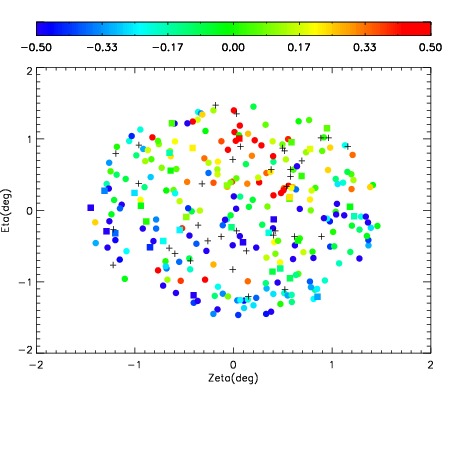
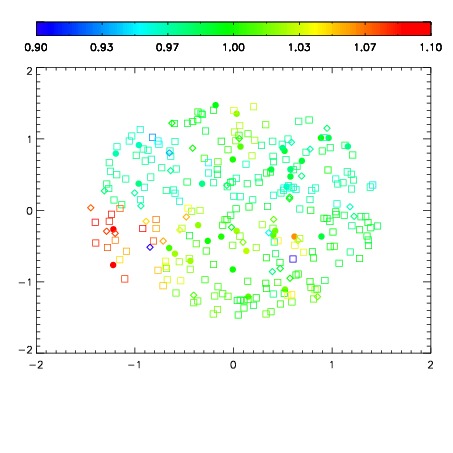
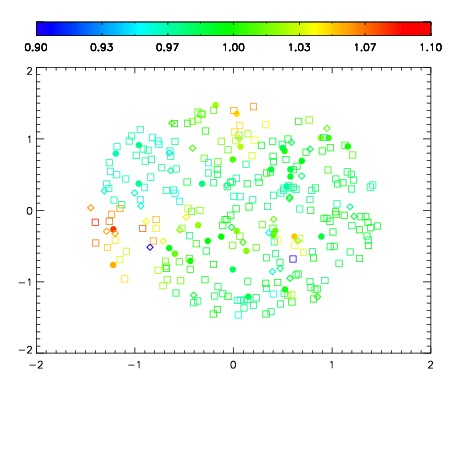
| Spatial sky telluric CO2 absorption deviations (filled: H < 10)
|
| 11420075
| 47
| | Red | Green | Blue
| | z | | 16.61
| | znorm | | 12.43
| | sky | 13.1 | 13.1 | 13.2
| | S/N | 1.8 | 3.8 | 4.6
| | S/N(c) | 1.7 | 3.3 | 4.1
| | SN(E/C) 0.83
|
| 
| 
| 
| 
| 
|
| 11420076
| 47
| | Red | Green | Blue
| | z | | 13.04
| | znorm | | 8.86
| | sky | 13.1 | 13.2 | 13.6
| | S/N | 0.0 | 0.2 | 0.9
| | S/N(c) | 0.0 | 0.0 | 0.0
| | SN(E/C) 8.19
|
| 
| 
| 
| 
| 
|
| 11420077
| 47
| | Red | Green | Blue
| | z | | 14.51
| | znorm | | 10.33
| | sky | 13.2 | 13.2 | 13.5
| | S/N | 0.2 | 0.7 | 0.8
| | S/N(c) | 0.3 | 0.6 | 0.9
| | SN(E/C) 0.97
|
| 
| 
| 
| 
| 
|
| 11420078
| 47
| | Red | Green | Blue
| | z | | 14.82
| | znorm | | 10.64
| | sky | 13.4 | 13.4 | 13.7
| | S/N | 0.4 | 0.9 | 1.4
| | S/N(c) | 0.3 | 0.8 | 1.4
| | SN(E/C) 0.99
|
| 
| 
| 
| 
| 
|
| 11420079
| 47
| | Red | Green | Blue
| | z | | 15.50
| | znorm | | 11.32
| | sky | 13.3 | 13.3 | 13.5
| | S/N | 0.8 | 1.5 | 2.1
| | S/N(c) | 0.6 | 1.6 | 2.0
| | SN(E/C) 0.96
|
| 
| 
| 
| 
| 
|
| 11420080
| 47
| | Red | Green | Blue
| | z | | 15.25
| | znorm | | 11.07
| | sky | 13.3 | 13.3 | 13.6
| | S/N | 0.6 | 1.1 | 1.7
| | S/N(c) | 0.6 | 1.3 | 1.7
| | SN(E/C) 1.02
|
| 
| 
| 
| 
| 
|
| 11420081
| 47
| | Red | Green | Blue
| | z | | 14.40
| | znorm | | 10.22
| | sky | 13.4 | 13.4 | 13.7
| | S/N | 0.2 | 0.5 | 0.9
| | S/N(c) | 0.2 | 0.6 | 0.9
| | SN(E/C) 0.93
|
| 
| 
| 
| 
| 
|
| 11420082
| 47
| | Red | Green | Blue
| | z | | 15.66
| | znorm | | 11.48
| | sky | 13.3 | 13.3 | 13.5
| | S/N | 0.8 | 1.7 | 2.1
| | S/N(c) | 0.8 | 1.7 | 2.3
| | SN(E/C) 0.94
|
| 
| 
| 
| 
| 
|
| 11420083
| 47
| | Red | Green | Blue
| | z | | 15.88
| | znorm | | 11.69
| | sky | 13.4 | 13.4 | 13.7
| | S/N | 1.0 | 2.2 | 2.9
| | S/N(c) | 1.0 | 2.0 | 2.6
| | SN(E/C) 0.89
|
| 
| 
| 
| 
| 
|
| 11420084
| 47
| | Red | Green | Blue
| | z | | 15.68
| | znorm | | 11.50
| | sky | 13.4 | 13.4 | 13.6
| | S/N | 0.9 | 1.9 | 2.4
| | S/N(c) | 0.8 | 1.7 | 2.0
| | SN(E/C) 0.91
|
| 
| 
| 
| 
| 
|
| 11420085
| 47
| | Red | Green | Blue
| | z | | 15.67
| | znorm | | 11.49
| | sky | 13.5 | 13.5 | 13.8
| | S/N | 0.9 | 1.7 | 2.7
| | S/N(c) | 0.8 | 1.8 | 2.3
| | SN(E/C) 0.90
|
| 
| 
| 
| 
| 
|
| 11420086
| 47
| | Red | Green | Blue
| | z | | 14.91
| | znorm | | 10.73
| | sky | 13.3 | 13.3 | 13.7
| | S/N | 0.4 | 0.6 | 1.4
| | S/N(c) | 0.4 | 0.8 | 1.3
| | SN(E/C) 0.96
|
| 
| 
| 
| 
| 
|