| Red | Green | Blue | |
| z | 17.67 | ||
| znorm | Inf | ||
| sky | -Inf | -Inf | -Inf |
| S/N | 1.8 | 3.7 | 4.4 |
| S/N(c) | 0.0 | 0.0 | 0.0 |
| SN(E/C) |
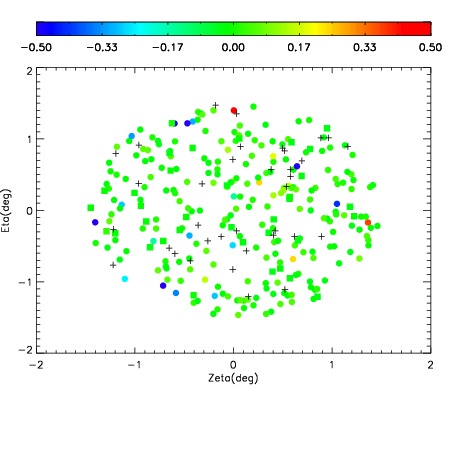
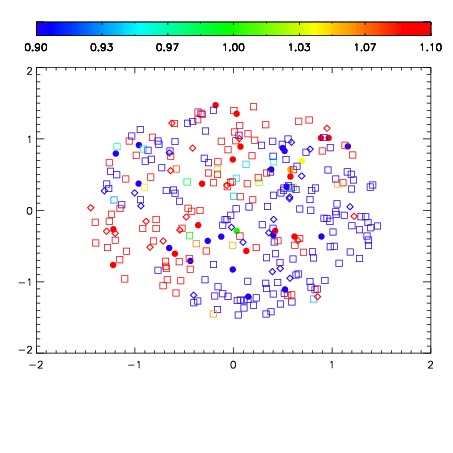
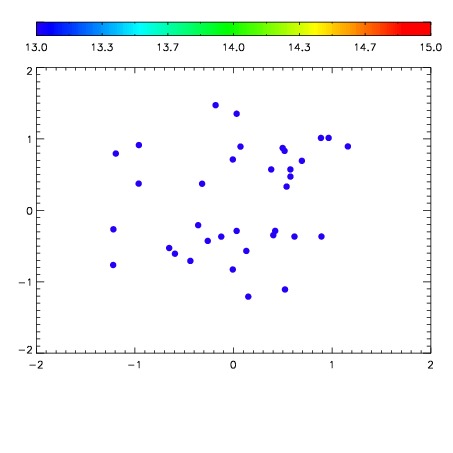

| Frame | Nreads | Zeropoints | Mag plots | Spatial mag deviation | Spatial sky 16325A emission deviations (filled: sky, open: star) | Spatial sky continuum emission | Spatial sky telluric CO2 absorption deviations (filled: H < 10) | |||||||||||||||||||||||
| 0 | 0 |
|
|
|
|
|
|
| IPAIR | NAME | SHIFT | NEWSHIFT | S/N | NAME | SHIFT | NEWSHIFT | S/N |
| 0 | 11420077 | 0.483584 | 0.00000 | 22.0019 | 11420079 | -0.00133595 | 0.484920 | 39.4865 |
| 1 | 11420084 | 0.482477 | 0.00110698 | 43.0786 | 11420075 | 0.00000 | 0.483584 | 69.1684 |
| 2 | 11420085 | 0.482637 | 0.000946999 | 41.9538 | 11420083 | -0.00147231 | 0.485056 | 47.4954 |
| 3 | 11420080 | 0.482656 | 0.000927985 | 35.8316 | 11420082 | -0.00157910 | 0.485163 | 42.6696 |
| 4 | 11420081 | 0.482581 | 0.00100300 | 19.5691 | 11420086 | -0.000958344 | 0.484542 | 27.7501 |