| Red | Green | Blue | |
| z | 17.64 | ||
| znorm | Inf | ||
| sky | -Inf | -Inf | -Inf |
| S/N | 17.7 | 33.8 | 36.2 |
| S/N(c) | 0.0 | 0.0 | 0.0 |
| SN(E/C) |
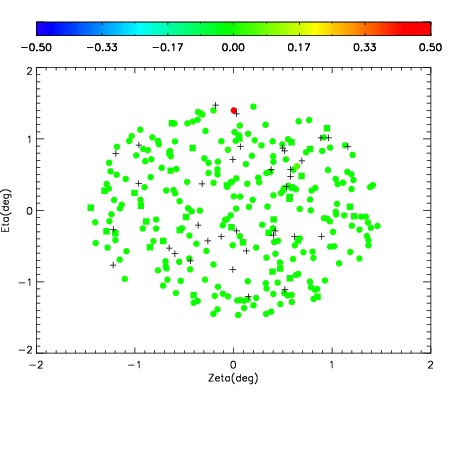

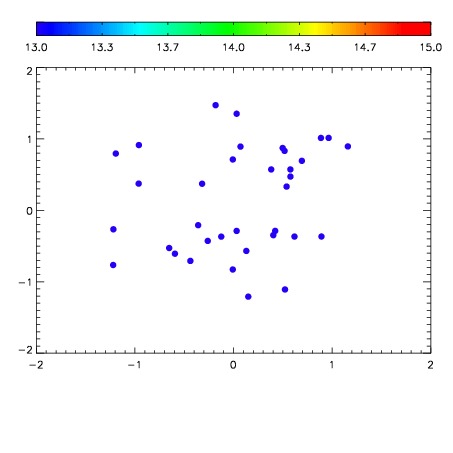

| Frame | Nreads | Zeropoints | Mag plots | Spatial mag deviation | Spatial sky 16325A emission deviations (filled: sky, open: star) | Spatial sky continuum emission | Spatial sky telluric CO2 absorption deviations (filled: H < 10) | |||||||||||||||||||||||
| 0 | 0 |
|
|
|
|
|
|
| IPAIR | NAME | SHIFT | NEWSHIFT | S/N | NAME | SHIFT | NEWSHIFT | S/N |
| 0 | 11460026 | 0.478893 | 0.00000 | 162.359 | 11460027 | -0.00307018 | 0.481963 | 166.459 |
| 1 | 11460029 | 0.477311 | 0.00158203 | 166.011 | 11460028 | -0.00293709 | 0.481830 | 177.594 |
| 2 | 11460030 | 0.477852 | 0.00104102 | 165.053 | 11460031 | -0.00271498 | 0.481608 | 175.211 |
| 3 | 11460025 | 0.478720 | 0.000173002 | 149.101 | 11460024 | 0.00000 | 0.478893 | 160.808 |