| Red | Green | Blue | |
| z | 17.64 | ||
| znorm | Inf | ||
| sky | -Inf | -Inf | -Inf |
| S/N | 12.0 | 20.0 | 23.7 |
| S/N(c) | 0.0 | 0.0 | 0.0 |
| SN(E/C) |
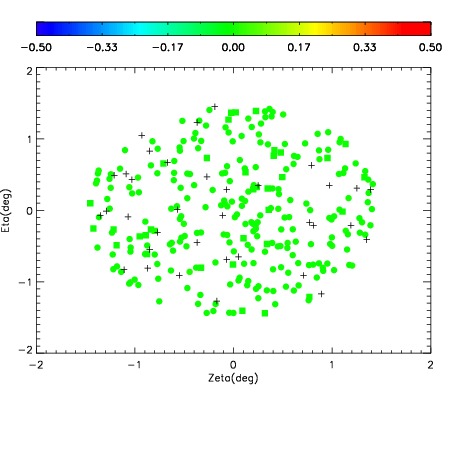

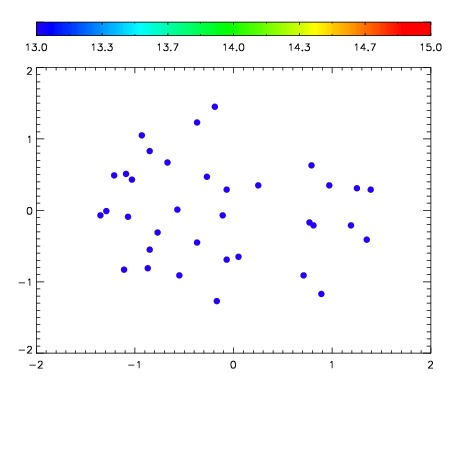

| Frame | Nreads | Zeropoints | Mag plots | Spatial mag deviation | Spatial sky 16325A emission deviations (filled: sky, open: star) | Spatial sky continuum emission | Spatial sky telluric CO2 absorption deviations (filled: H < 10) | |||||||||||||||||||||||
| 0 | 0 |
|
|
|
|
|
|
| IPAIR | NAME | SHIFT | NEWSHIFT | S/N | NAME | SHIFT | NEWSHIFT | S/N |
| 0 | 12030075 | 0.500991 | 0.00000 | 127.233 | 12030074 | -0.000902372 | 0.501893 | 127.049 |
| 1 | 12030076 | 0.500933 | 5.79953e-05 | 138.116 | 12030077 | -0.00144246 | 0.502433 | 137.468 |
| 2 | 12030071 | 0.499624 | 0.00136697 | 120.357 | 12030073 | -0.00123757 | 0.502229 | 125.786 |
| 3 | 12030072 | 0.500122 | 0.000868976 | 115.344 | 12030070 | 0.00000 | 0.500991 | 125.065 |