| Red | Green | Blue | |
| z | 17.64 | ||
| znorm | Inf | ||
| sky | -Inf | -Inf | -Inf |
| S/N | 31.8 | 50.8 | 53.7 |
| S/N(c) | 0.0 | 0.0 | 0.0 |
| SN(E/C) |
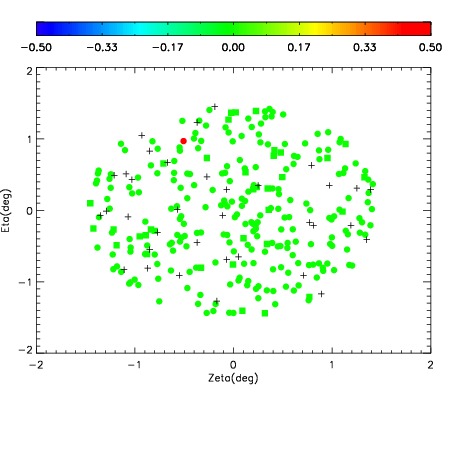

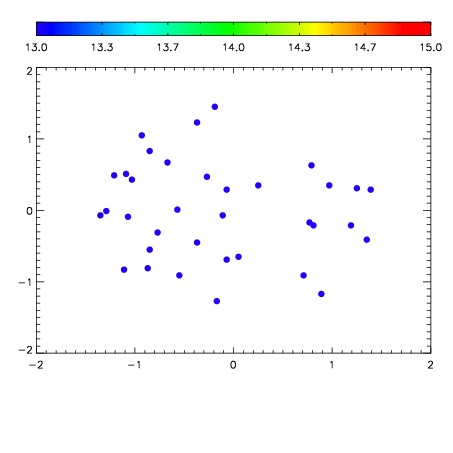

| Frame | Nreads | Zeropoints | Mag plots | Spatial mag deviation | Spatial sky 16325A emission deviations (filled: sky, open: star) | Spatial sky continuum emission | Spatial sky telluric CO2 absorption deviations (filled: H < 10) | |||||||||||||||||||||||
| 0 | 0 |
|
|
|
|
|
|
| IPAIR | NAME | SHIFT | NEWSHIFT | S/N | NAME | SHIFT | NEWSHIFT | S/N |
| 0 | 12100085 | 0.497017 | 0.00000 | 211.506 | 12100086 | -0.00492670 | 0.501944 | 214.046 |
| 1 | 12100089 | 0.492470 | 0.00454700 | 214.108 | 12100087 | -0.00509555 | 0.502113 | 215.610 |
| 2 | 12100088 | 0.492396 | 0.00462100 | 212.356 | 12100090 | -0.00740953 | 0.504427 | 214.577 |
| 3 | 12100084 | 0.497002 | 1.49906e-05 | 207.440 | 12100083 | 0.00000 | 0.497017 | 210.736 |