| Red | Green | Blue | |
| z | 17.64 | ||
| znorm | Inf | ||
| sky | -Inf | -Inf | -Inf |
| S/N | 17.8 | 33.8 | 35.6 |
| S/N(c) | 0.0 | 0.0 | 0.0 |
| SN(E/C) |

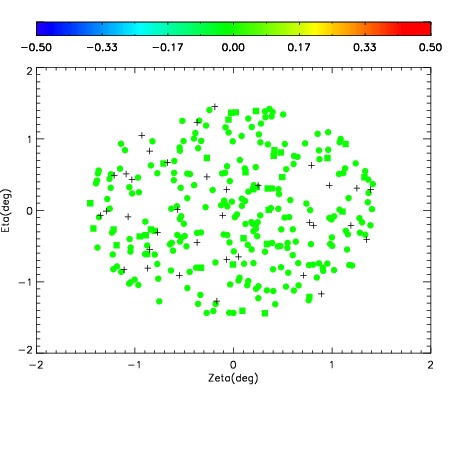
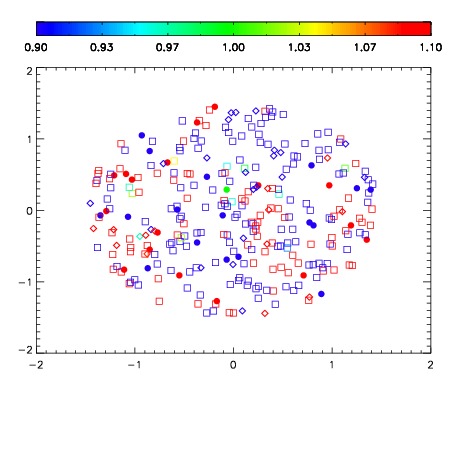
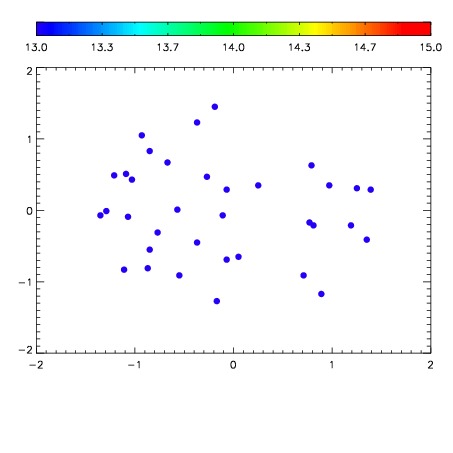

| Frame | Nreads | Zeropoints | Mag plots | Spatial mag deviation | Spatial sky 16325A emission deviations (filled: sky, open: star) | Spatial sky continuum emission | Spatial sky telluric CO2 absorption deviations (filled: H < 10) | |||||||||||||||||||||||
| 0 | 0 |
|
|
|
|
|
|
| IPAIR | NAME | SHIFT | NEWSHIFT | S/N | NAME | SHIFT | NEWSHIFT | S/N |
| 0 | 12140064 | 0.497284 | 0.00000 | 116.466 | 12140065 | 0.000411045 | 0.496873 | 129.705 |
| 1 | 12140059 | 0.492419 | 0.00486499 | 165.254 | 12140058 | 0.00000 | 0.497284 | 158.456 |
| 2 | 12140060 | 0.492908 | 0.00437599 | 159.423 | 12140061 | 0.00203821 | 0.495246 | 155.279 |
| 3 | 12140063 | 0.496068 | 0.00121599 | 123.945 | 12140062 | 0.00261097 | 0.494673 | 145.049 |