| Red | Green | Blue | |
| z | 17.64 | ||
| znorm | Inf | ||
| sky | -Inf | -Inf | -Inf |
| S/N | 20.6 | 38.0 | 42.9 |
| S/N(c) | 0.0 | 0.0 | 0.0 |
| SN(E/C) |
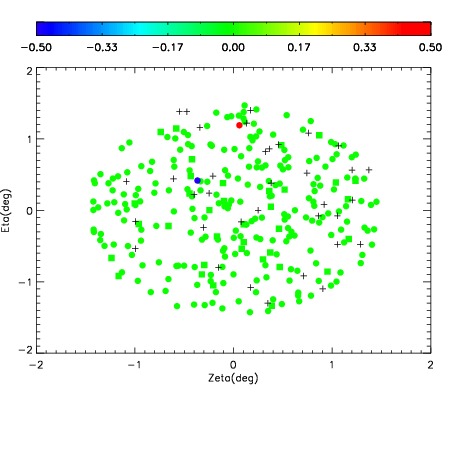
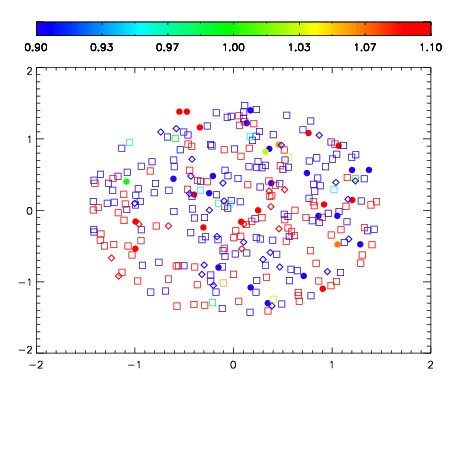
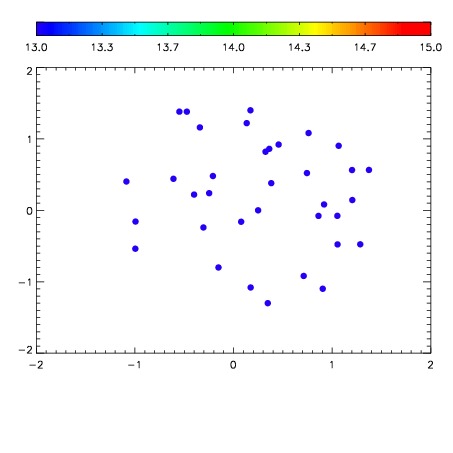

| Frame | Nreads | Zeropoints | Mag plots | Spatial mag deviation | Spatial sky 16325A emission deviations (filled: sky, open: star) | Spatial sky continuum emission | Spatial sky telluric CO2 absorption deviations (filled: H < 10) | |||||||||||||||||||||||
| 0 | 0 |
|
|
|
|
|
|
| IPAIR | NAME | SHIFT | NEWSHIFT | S/N | NAME | SHIFT | NEWSHIFT | S/N |
| 0 | 08700043 | 0.478546 | 0.00000 | 186.605 | 08700044 | 0.00277171 | 0.475774 | 183.596 |
| 1 | 08700039 | 0.477901 | 0.000644982 | 195.448 | 08700041 | 0.000779324 | 0.477767 | 197.217 |
| 2 | 08700042 | 0.478325 | 0.000220984 | 194.875 | 08700040 | 0.00125064 | 0.477295 | 196.459 |
| 3 | 08700038 | 0.477035 | 0.00151101 | 184.685 | 08700037 | 0.00000 | 0.478546 | 178.639 |