| Red | Green | Blue | |
| z | 17.64 | ||
| znorm | Inf | ||
| sky | -NaN | -Inf | -Inf |
| S/N | 26.7 | 46.9 | 49.2 |
| S/N(c) | 0.0 | 0.0 | 0.0 |
| SN(E/C) |


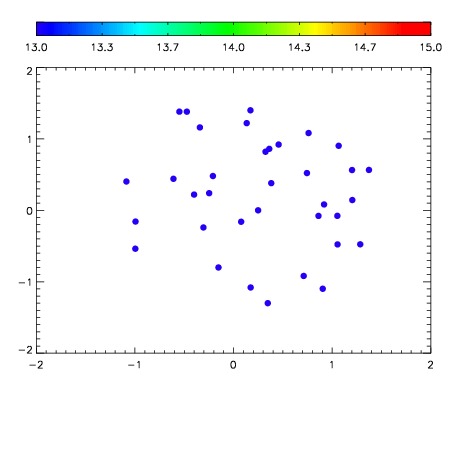

| Frame | Nreads | Zeropoints | Mag plots | Spatial mag deviation | Spatial sky 16325A emission deviations (filled: sky, open: star) | Spatial sky continuum emission | Spatial sky telluric CO2 absorption deviations (filled: H < 10) | |||||||||||||||||||||||
| 0 | 0 |
|
|
|
|
|
|
| IPAIR | NAME | SHIFT | NEWSHIFT | S/N | NAME | SHIFT | NEWSHIFT | S/N |
| 0 | 09080017 | 0.479931 | 0.00000 | 247.152 | 09080018 | -0.000446004 | 0.480377 | 247.323 |
| 1 | 09080016 | 0.478960 | 0.000970989 | 239.453 | 09080015 | -0.000585296 | 0.480516 | 243.078 |
| 2 | 09080013 | 0.479443 | 0.000487983 | 235.972 | 09080014 | -0.000784354 | 0.480715 | 239.768 |
| 3 | 09080012 | 0.478961 | 0.000970006 | 230.449 | 09080011 | 0.00000 | 0.479931 | 219.162 |