| Frame | Nreads | Zeropoints | Mag plots
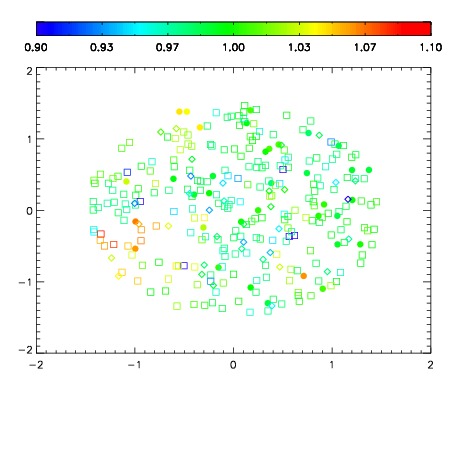
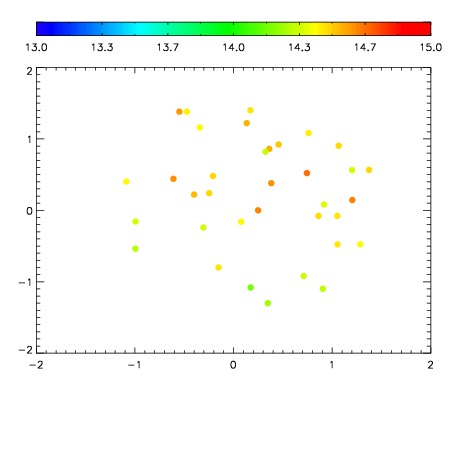
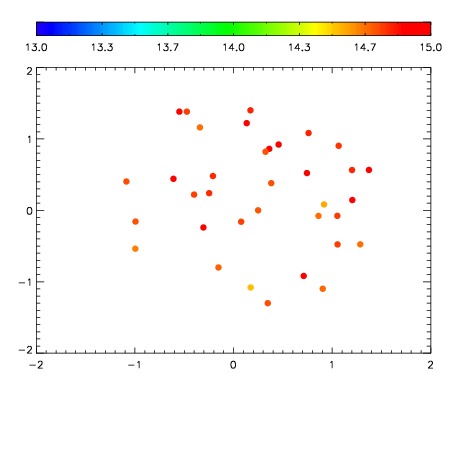
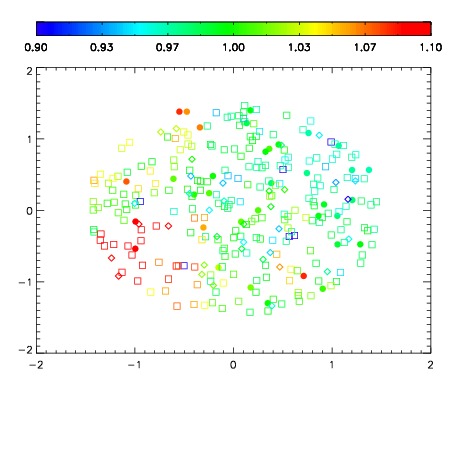
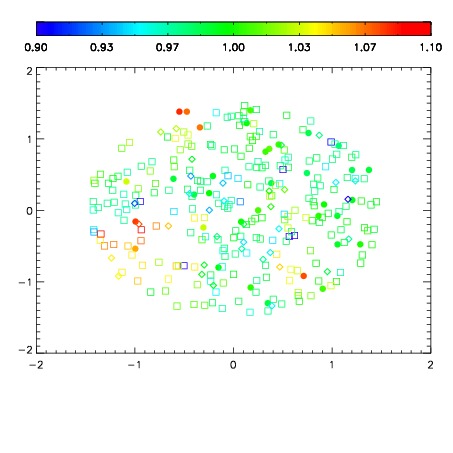
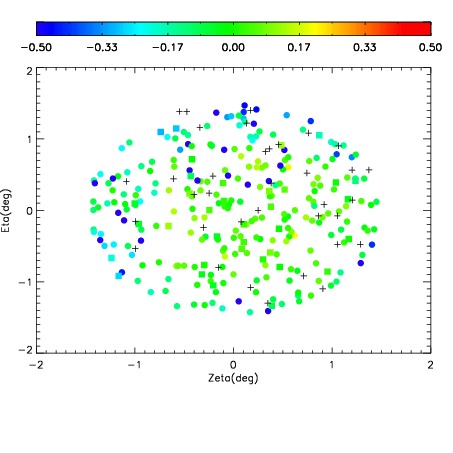
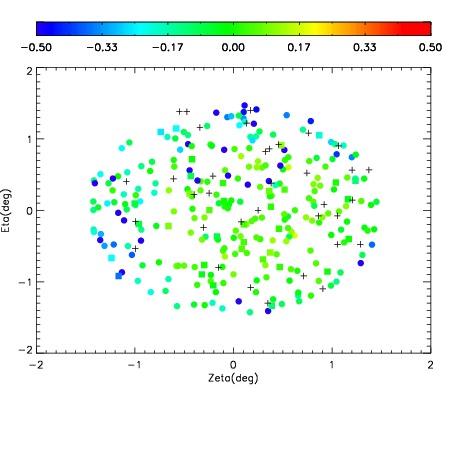
| Spatial mag deviation
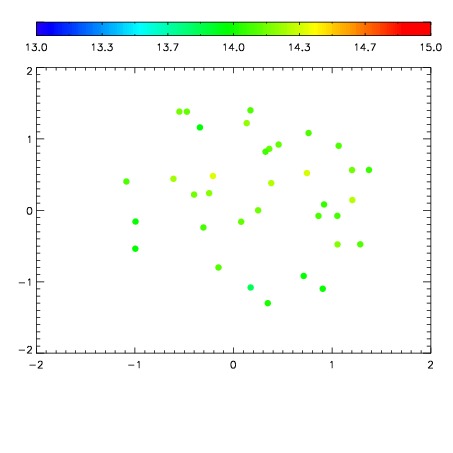
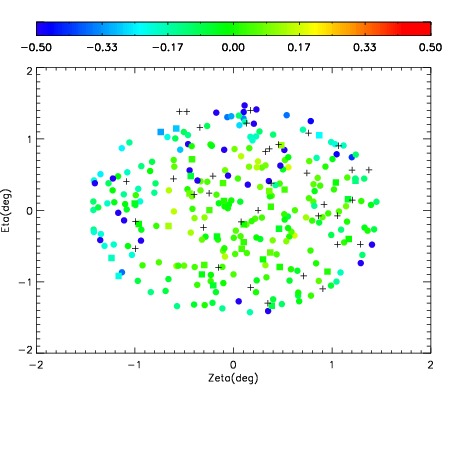
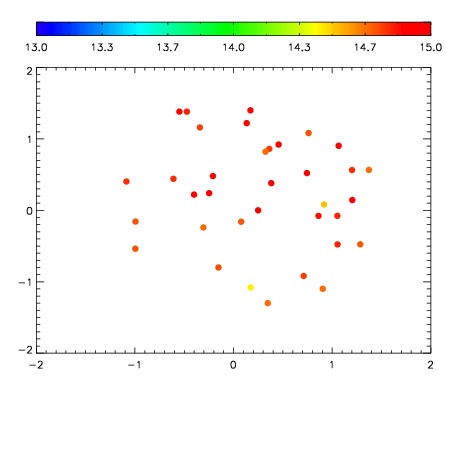
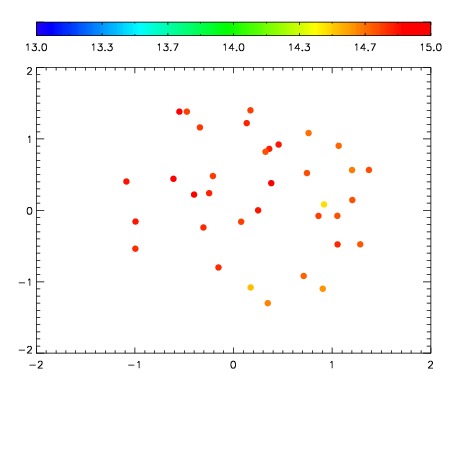
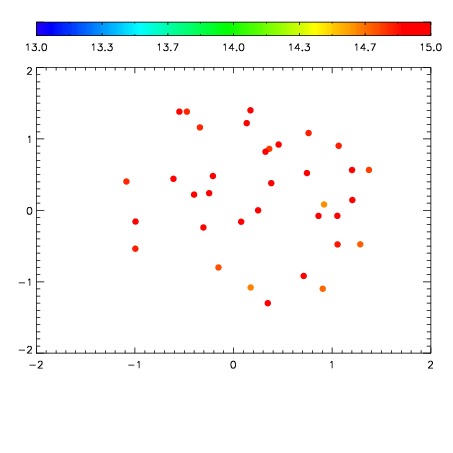
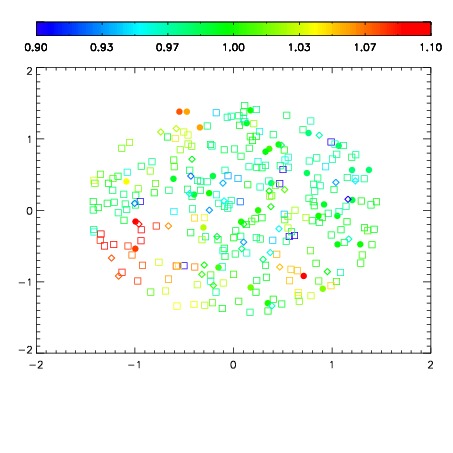
| Spatial sky 16325A emission deviations (filled: sky, open: star)
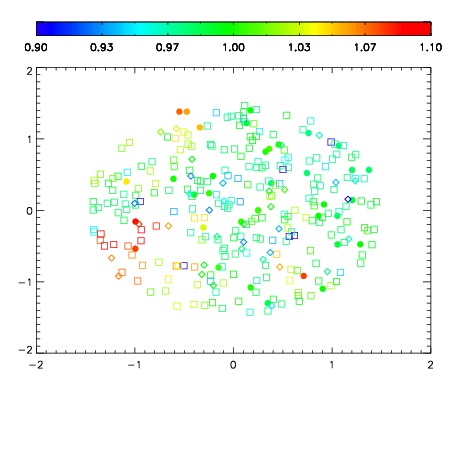
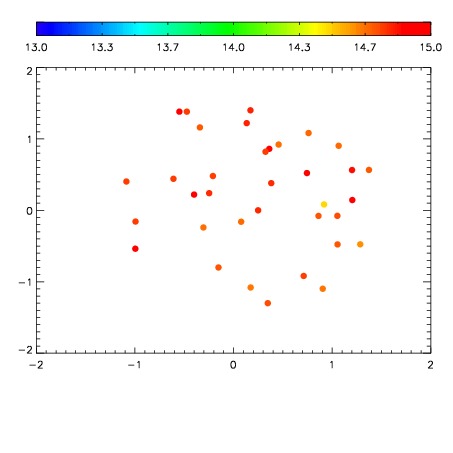
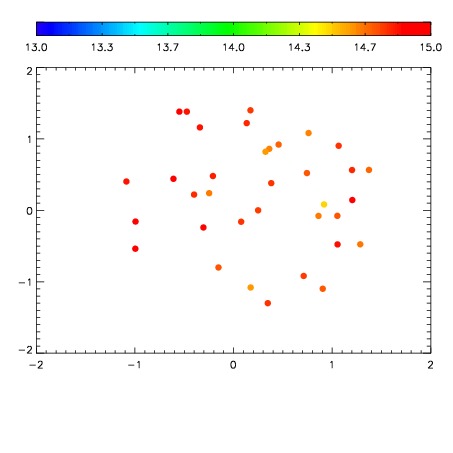
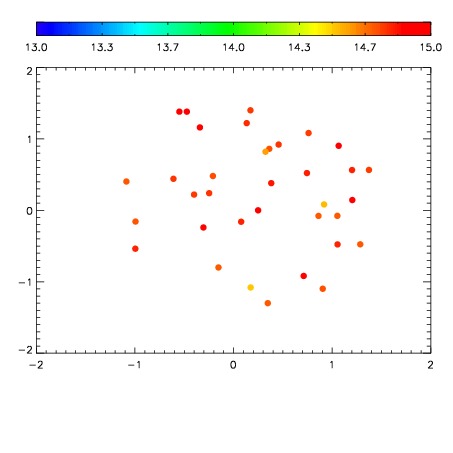
| Spatial sky continuum emission
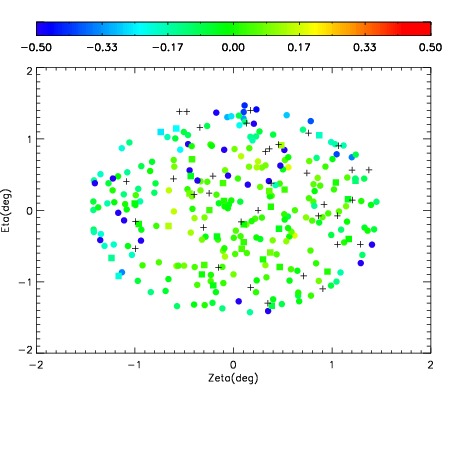
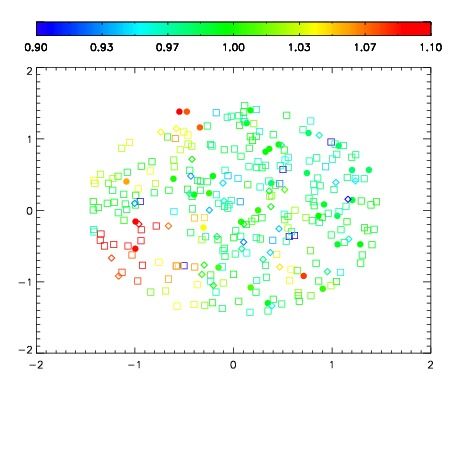
| Spatial sky telluric CO2 absorption deviations (filled: H < 10)
|
| 11410089
| 47
| | Red | Green | Blue
| | z | | 18.68
| | znorm | | 14.50
| | sky | 14.5 | 14.1 | 14.1
| | S/N | 11.8 | 19.5 | 23.2
| | S/N(c) | 10.2 | 18.2 | 21.8
| | SN(E/C) 0.45
|
| 
| 
| 
| 
| 
|
| 11410090
| 47
| | Red | Green | Blue
| | z | | 18.84
| | znorm | | 14.66
| | sky | 14.9 | 14.5 | 14.7
| | S/N | 12.9 | 21.7 | 26.0
| | S/N(c) | 11.0 | 20.3 | 24.2
| | SN(E/C) 0.41
|
| 
| 
| 
| 
| 
|
| 11410091
| 47
| | Red | Green | Blue
| | z | | 19.00
| | znorm | | 14.82
| | sky | 14.8 | 14.6 | 15.1
| | S/N | 14.3 | 23.8 | 28.0
| | S/N(c) | 12.5 | 22.3 | 26.3
| | SN(E/C) 0.39
|
| 
| 
| 
| 
| 
|
| 11410092
| 47
| | Red | Green | Blue
| | z | | 19.00
| | znorm | | 14.82
| | sky | 15.1 | 14.8 | 15.1
| | S/N | 14.4 | 24.1 | 27.9
| | S/N(c) | 12.4 | 22.6 | 26.3
| | SN(E/C) 0.39
|
| 
| 
| 
| 
| 
|
| 11410093
| 47
| | Red | Green | Blue
| | z | | 18.94
| | znorm | | 14.76
| | sky | 15.1 | 14.8 | 15.0
| | S/N | 13.8 | 23.4 | 27.0
| | S/N(c) | 11.9 | 21.8 | 25.5
| | SN(E/C) 0.42
|
| 
| 
| 
| 
| 
|
| 11410094
| 47
| | Red | Green | Blue
| | z | | 18.88
| | znorm | | 14.70
| | sky | 15.1 | 14.8 | 15.0
| | S/N | 13.3 | 22.8 | 25.9
| | S/N(c) | 11.5 | 20.9 | 24.3
| | SN(E/C) 0.43
|
| 
| 
| 
| 
| 
|
| 11410095
| 47
| | Red | Green | Blue
| | z | | 18.96
| | znorm | | 14.78
| | sky | 14.9 | 14.8 | 15.1
| | S/N | 13.9 | 23.6 | 27.1
| | S/N(c) | 12.0 | 21.7 | 25.3
| | SN(E/C) 0.41
|
| 
| 
| 
| 
| 
|
| 11410096
| 47
| | Red | Green | Blue
| | z | | 18.93
| | znorm | | 14.75
| | sky | 15.0 | 14.9 | 15.0
| | S/N | 13.9 | 23.6 | 26.5
| | S/N(c) | 11.9 | 21.8 | 25.0
| | SN(E/C) 0.40
|
| 
| 
| 
| 
| 
|
| 11410097
| 47
| | Red | Green | Blue
| | z | | 18.97
| | znorm | | 14.79
| | sky | 15.1 | 14.8 | 15.0
| | S/N | 14.3 | 23.9 | 27.3
| | S/N(c) | 12.3 | 21.9 | 25.5
| | SN(E/C) 0.41
|
| 
| 
| 
| 
| 
|
| 11410098
| 47
| | Red | Green | Blue
| | z | | 19.02
| | znorm | | 14.84
| | sky | 15.1 | 14.8 | 15.0
| | S/N | 14.7 | 24.5 | 27.7
| | S/N(c) | 12.8 | 22.7 | 26.1
| | SN(E/C) 0.40
|
| 
| 
| 
| 
| 
|