| Red | Green | Blue | |
| z | 17.64 | ||
| znorm | Inf | ||
| sky | -Inf | -Inf | -Inf |
| S/N | 26.3 | 48.0 | 56.4 |
| S/N(c) | 0.0 | 0.0 | 0.0 |
| SN(E/C) |
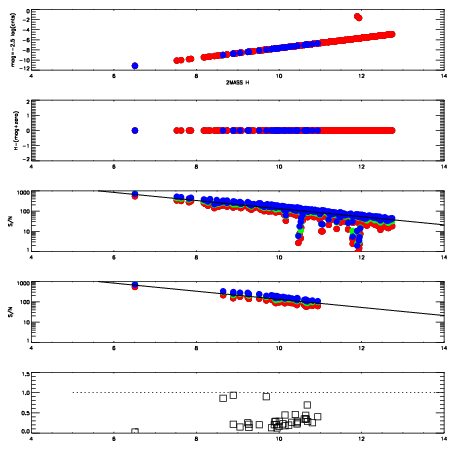
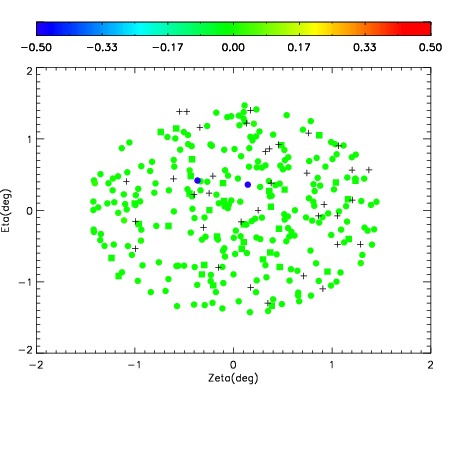
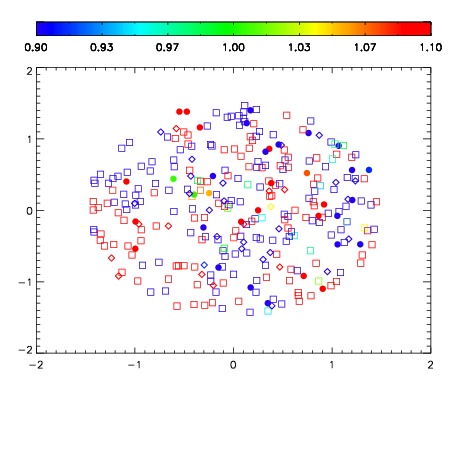
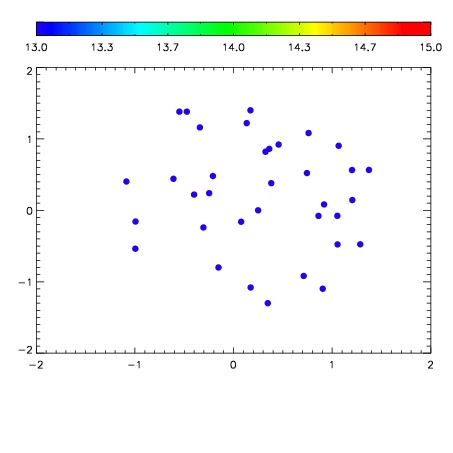

| Frame | Nreads | Zeropoints | Mag plots | Spatial mag deviation | Spatial sky 16325A emission deviations (filled: sky, open: star) | Spatial sky continuum emission | Spatial sky telluric CO2 absorption deviations (filled: H < 10) | |||||||||||||||||||||||
| 0 | 0 |
|
|
|
|
|
|
| IPAIR | NAME | SHIFT | NEWSHIFT | S/N | NAME | SHIFT | NEWSHIFT | S/N |
| 0 | 11410094 | 0.481974 | 0.00000 | 192.384 | 11410093 | -0.00139212 | 0.483366 | 197.677 |
| 1 | 11410098 | 0.480775 | 0.00119901 | 207.718 | 11410092 | -0.00123374 | 0.483208 | 204.823 |
| 2 | 11410091 | 0.480427 | 0.00154701 | 202.770 | 11410097 | -0.00138127 | 0.483355 | 202.184 |
| 3 | 11410095 | 0.481737 | 0.000237018 | 200.428 | 11410096 | -0.00177923 | 0.483753 | 201.641 |
| 4 | 11410090 | 0.479784 | 0.00218999 | 189.147 | 11410089 | 0.00000 | 0.481974 | 175.292 |