| Red | Green | Blue | |
| z | 17.64 | ||
| znorm | Inf | ||
| sky | -Inf | -Inf | -NaN |
| S/N | 23.8 | 41.2 | 43.6 |
| S/N(c) | 0.0 | 0.0 | 0.0 |
| SN(E/C) |
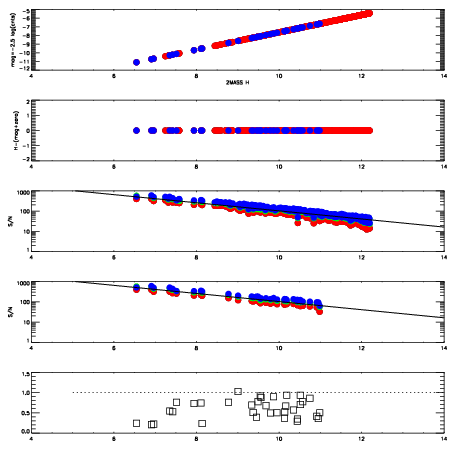
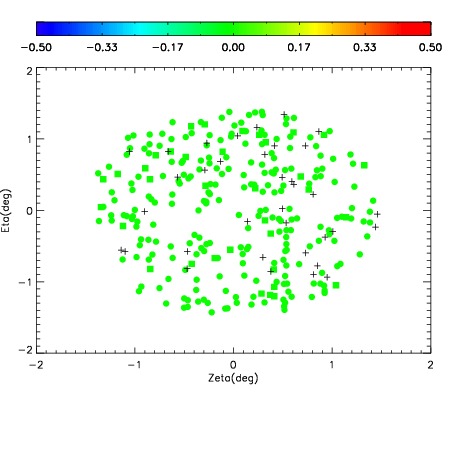
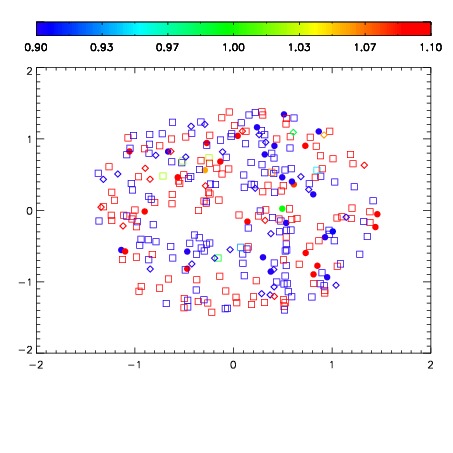
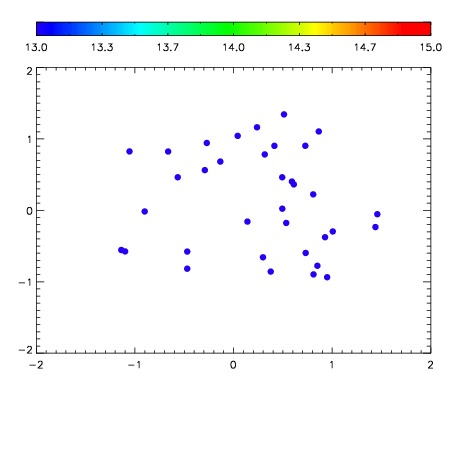

| Frame | Nreads | Zeropoints | Mag plots | Spatial mag deviation | Spatial sky 16325A emission deviations (filled: sky, open: star) | Spatial sky continuum emission | Spatial sky telluric CO2 absorption deviations (filled: H < 10) | |||||||||||||||||||||||
| 0 | 0 |
|
|
|
|
|
|
| IPAIR | NAME | SHIFT | NEWSHIFT | S/N | NAME | SHIFT | NEWSHIFT | S/N |
| 0 | 11480013 | 0.481510 | 0.00000 | 189.663 | 11480011 | 0.00000 | 0.481510 | 184.006 |
| 1 | 11480016 | 0.479937 | 0.00157303 | 200.581 | 11480014 | -0.000207189 | 0.481717 | 196.803 |
| 2 | 11480012 | 0.479912 | 0.00159800 | 189.795 | 11480015 | -0.000323391 | 0.481833 | 196.514 |