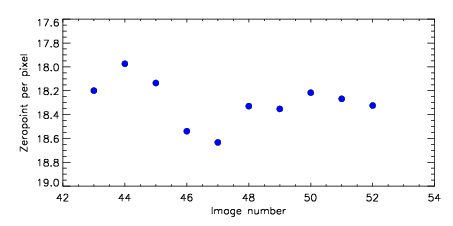
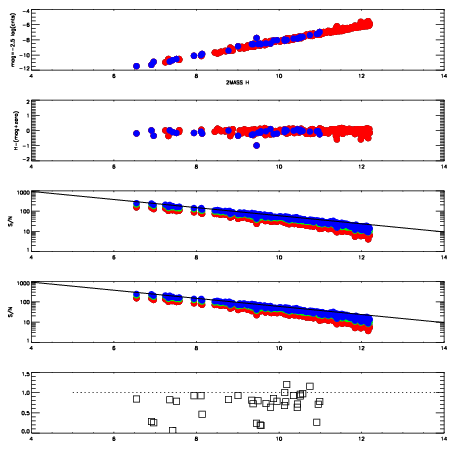
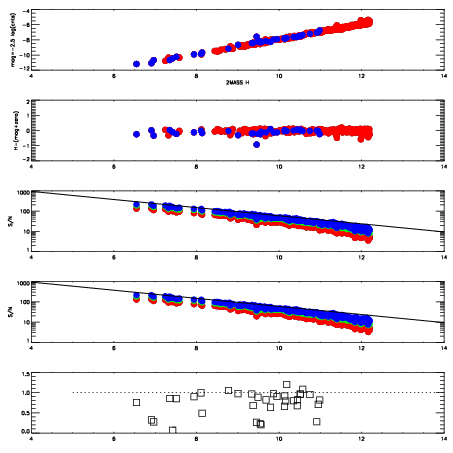
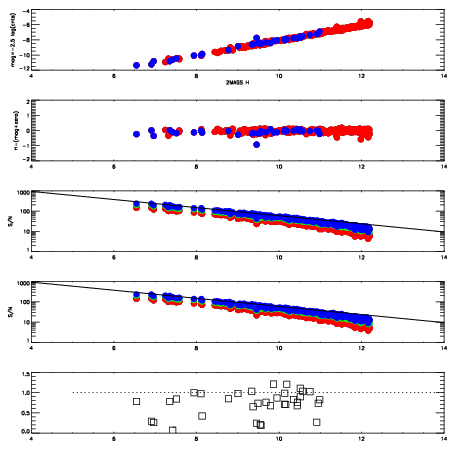
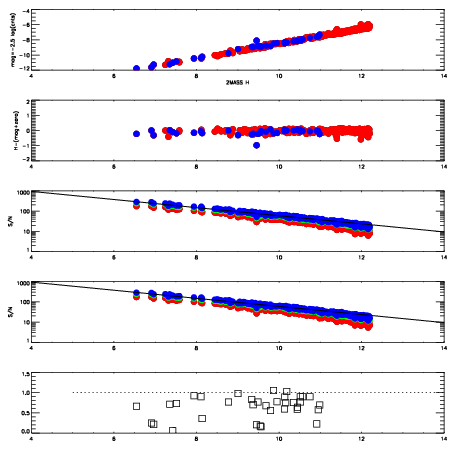
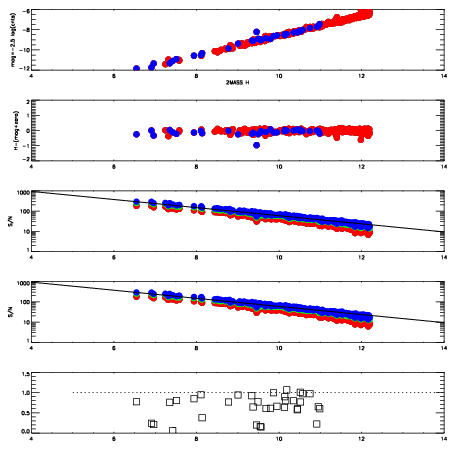
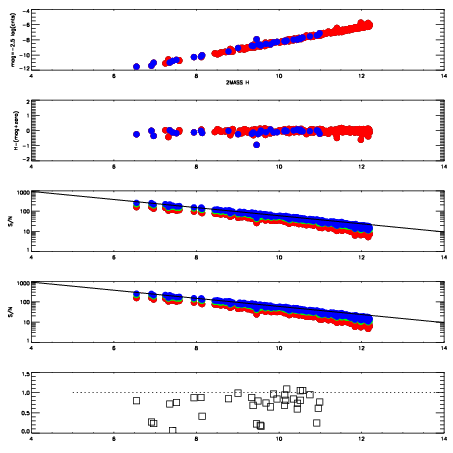
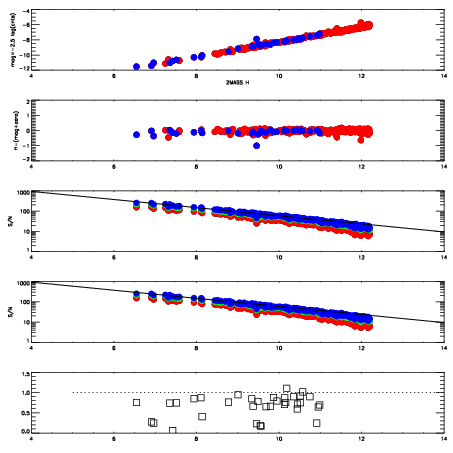
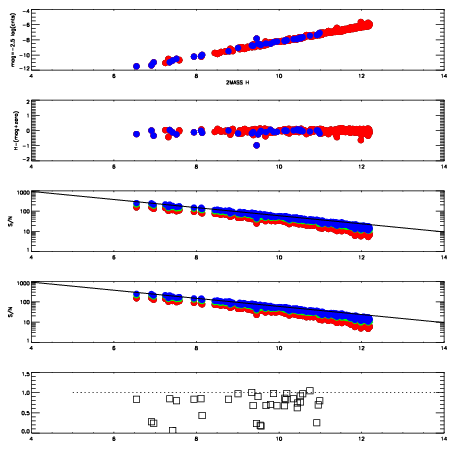
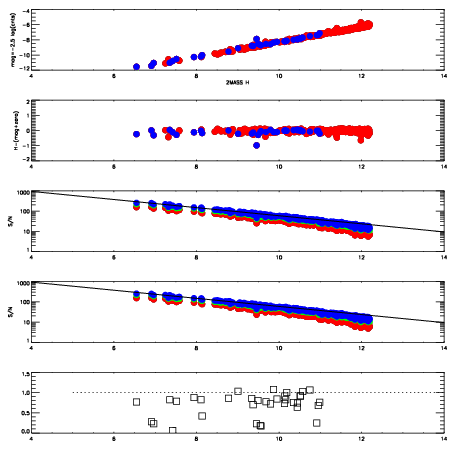
| Frame | Nreads | Zeropoints | Mag plots
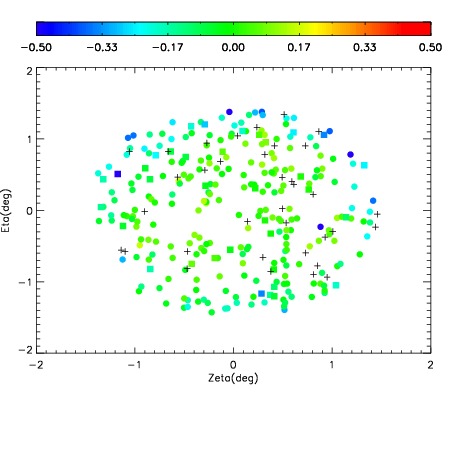
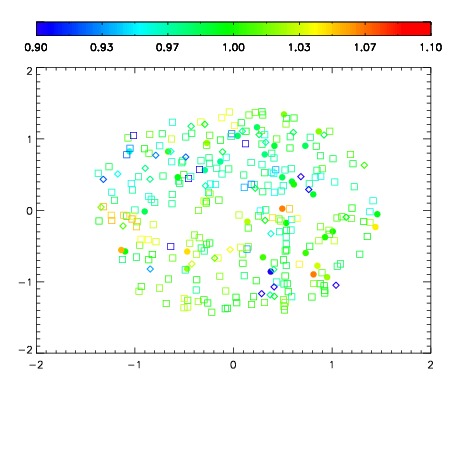
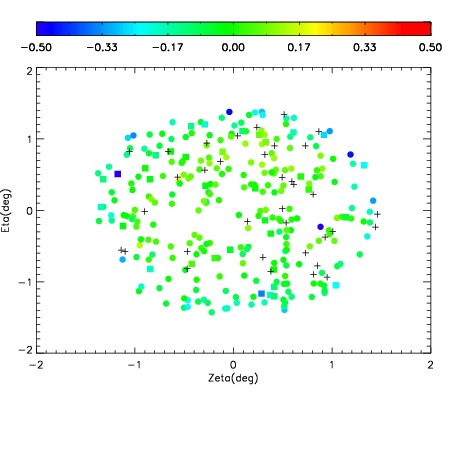
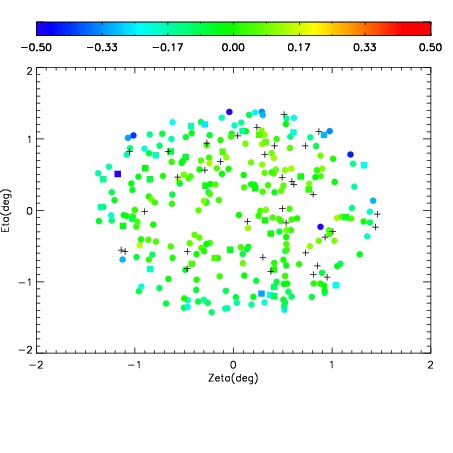
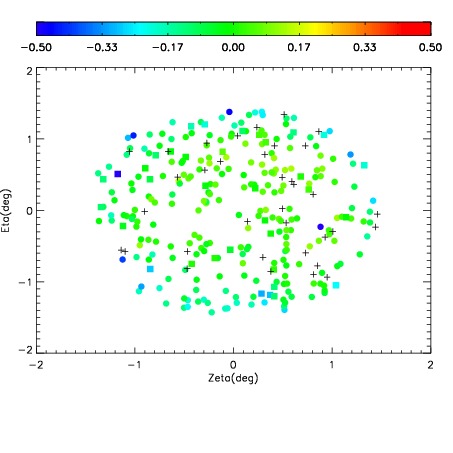
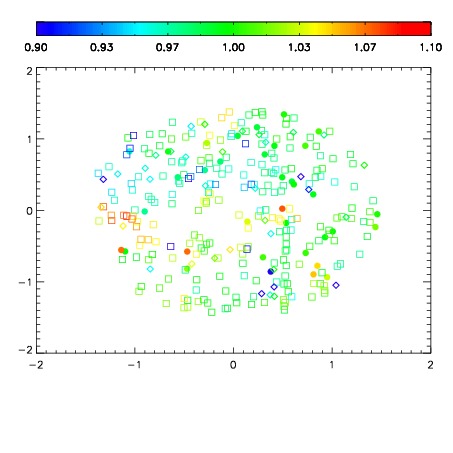
| Spatial mag deviation
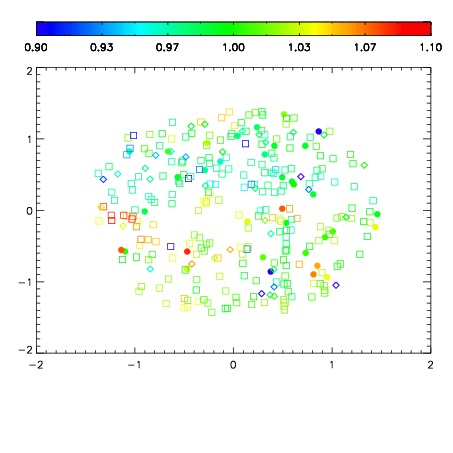
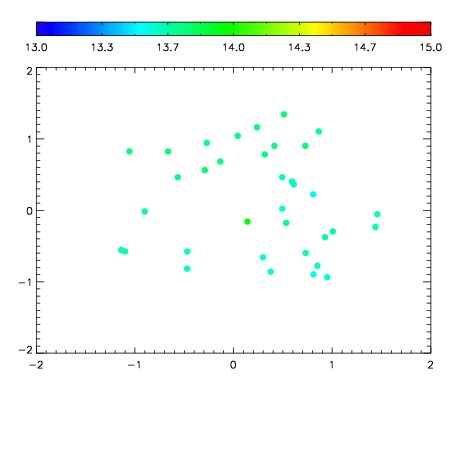
| Spatial sky 16325A emission deviations (filled: sky, open: star)
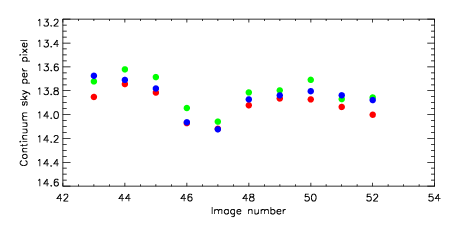
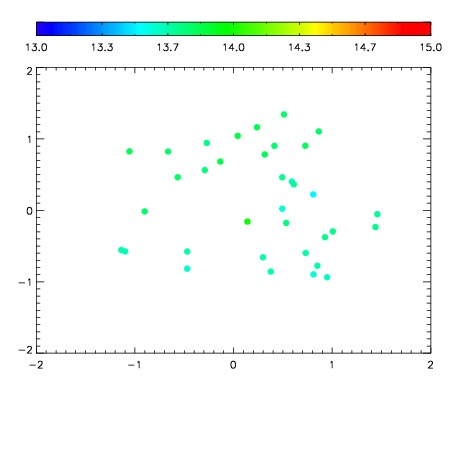
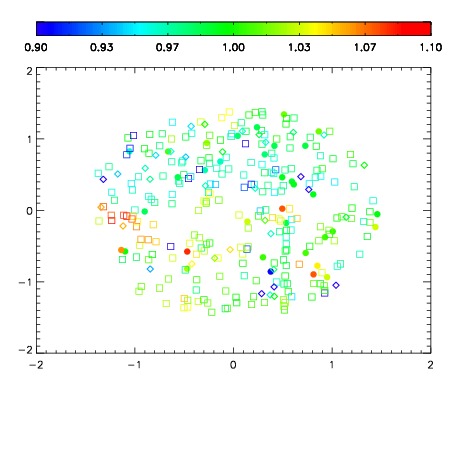
| Spatial sky continuum emission
| Spatial sky telluric CO2 absorption deviations (filled: H < 10)
|
| 11760043
| 47
| | Red | Green | Blue
| | z | | 18.20
| | znorm | | 14.02
| | sky | 13.9 | 13.7 | 13.7
| | S/N | 8.0 | 13.9 | 14.7
| | S/N(c) | 7.0 | 13.1 | 13.9
| | SN(E/C) 0.79
|
| 
| 
| 
| 
| 
|
| 11760044
| 47
| | Red | Green | Blue
| | z | | 17.97
| | znorm | | 13.79
| | sky | 13.7 | 13.6 | 13.7
| | S/N | 6.6 | 12.2 | 12.7
| | S/N(c) | 5.9 | 11.3 | 12.0
| | SN(E/C) 0.82
|
| 
| 
| 
| 
| 
|
| 11760045
| 47
| | Red | Green | Blue
| | z | | 18.14
| | znorm | | 13.96
| | sky | 13.8 | 13.7 | 13.8
| | S/N | 7.8 | 13.5 | 14.3
| | S/N(c) | 6.9 | 12.4 | 13.7
| | SN(E/C) 0.78
|
| 
| 
| 
| 
| 
|
| 11760046
| 47
| | Red | Green | Blue
| | z | | 18.54
| | znorm | | 14.36
| | sky | 14.1 | 13.9 | 14.1
| | S/N | 10.6 | 18.1 | 19.2
| | S/N(c) | 9.3 | 16.8 | 18.0
| | SN(E/C) 0.71
|
| 
| 
| 
| 
| 
|
| 11760047
| 47
| | Red | Green | Blue
| | z | | 18.63
| | znorm | | 14.45
| | sky | 14.1 | 14.1 | 14.1
| | S/N | 11.5 | 19.3 | 20.7
| | S/N(c) | 10.2 | 17.7 | 19.7
| | SN(E/C) 0.76
|
| 
| 
| 
| 
| 
|
| 11760048
| 47
| | Red | Green | Blue
| | z | | 18.33
| | znorm | | 14.15
| | sky | 13.9 | 13.8 | 13.9
| | S/N | 8.8 | 15.5 | 16.7
| | S/N(c) | 7.7 | 14.1 | 15.9
| | SN(E/C) 0.77
|
| 
| 
| 
| 
| 
|
| 11760049
| 47
| | Red | Green | Blue
| | z | | 18.35
| | znorm | | 14.17
| | sky | 13.9 | 13.8 | 13.8
| | S/N | 9.0 | 15.6 | 17.2
| | S/N(c) | 8.0 | 14.2 | 16.2
| | SN(E/C) 0.74
|
| 
| 
| 
| 
| 
|
| 11760050
| 47
| | Red | Green | Blue
| | z | | 18.22
| | znorm | | 14.04
| | sky | 13.9 | 13.7 | 13.8
| | S/N | 8.2 | 14.4 | 15.5
| | S/N(c) | 7.2 | 13.1 | 14.5
| | SN(E/C) 0.81
|
| 
| 
| 
| 
| 
|
| 11760051
| 47
| | Red | Green | Blue
| | z | | 18.27
| | znorm | | 14.09
| | sky | 13.9 | 13.9 | 13.8
| | S/N | 8.5 | 14.8 | 16.1
| | S/N(c) | 7.5 | 13.6 | 15.2
| | SN(E/C) 0.79
|
| 
| 
| 
| 
| 
|
| 11760052
| 47
| | Red | Green | Blue
| | z | | 18.32
| | znorm | | 14.14
| | sky | 14.0 | 13.9 | 13.9
| | S/N | 9.0 | 15.3 | 17.0
| | S/N(c) | 7.9 | 14.1 | 15.9
| | SN(E/C) 0.77
|
| 
| 
| 
| 
| 
|