| Red | Green | Blue | |
| z | 17.64 | ||
| znorm | Inf | ||
| sky | -Inf | -Inf | -Inf |
| S/N | 17.6 | 31.4 | 35.0 |
| S/N(c) | 0.0 | 0.0 | 0.0 |
| SN(E/C) |
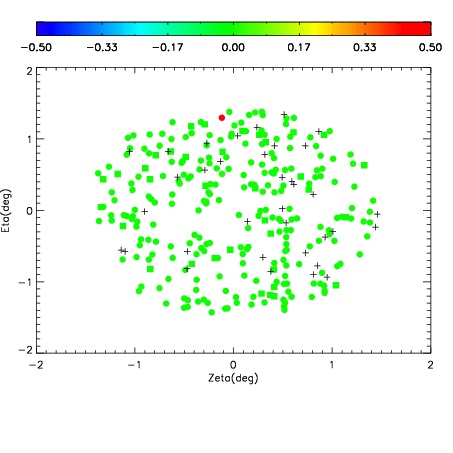
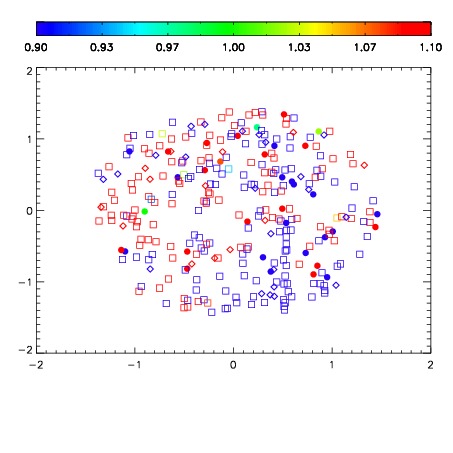
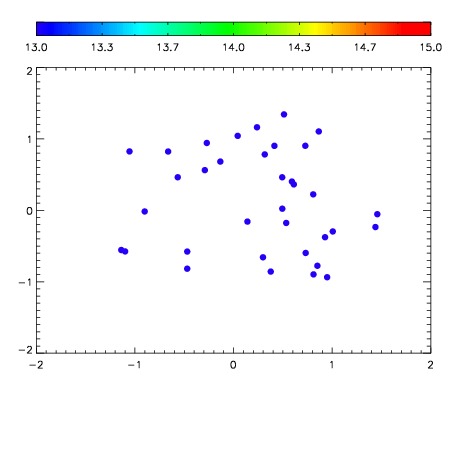

| Frame | Nreads | Zeropoints | Mag plots | Spatial mag deviation | Spatial sky 16325A emission deviations (filled: sky, open: star) | Spatial sky continuum emission | Spatial sky telluric CO2 absorption deviations (filled: H < 10) | |||||||||||||||||||||||
| 0 | 0 |
|
|
|
|
|
|
| IPAIR | NAME | SHIFT | NEWSHIFT | S/N | NAME | SHIFT | NEWSHIFT | S/N |
| 0 | 11760045 | 0.495028 | 0.00000 | 132.847 | 11760051 | -0.00175759 | 0.496786 | 136.604 |
| 1 | 11760048 | 0.494589 | 0.000438988 | 145.802 | 11760047 | -0.00103277 | 0.496061 | 165.033 |
| 2 | 11760049 | 0.495026 | 1.99676e-06 | 145.679 | 11760046 | -0.00136005 | 0.496388 | 160.036 |
| 3 | 11760052 | 0.494759 | 0.000268996 | 138.144 | 11760043 | 0.00000 | 0.495028 | 137.779 |
| 4 | 11760044 | 0.494274 | 0.000753999 | 120.172 | 11760050 | -0.00197148 | 0.496999 | 135.852 |