| Red | Green | Blue | |
| z | 17.64 | ||
| znorm | Inf | ||
| sky | -Inf | -Inf | -NaN |
| S/N | 27.0 | 45.7 | 48.9 |
| S/N(c) | 0.0 | 0.0 | 0.0 |
| SN(E/C) |

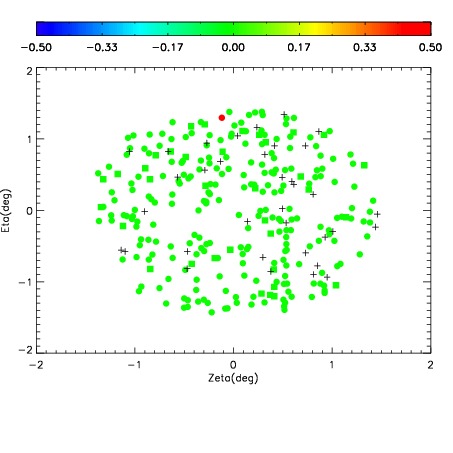
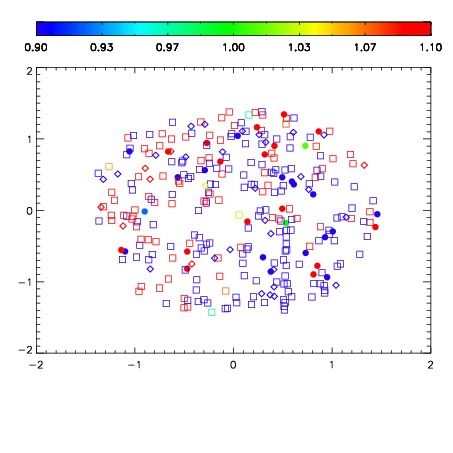
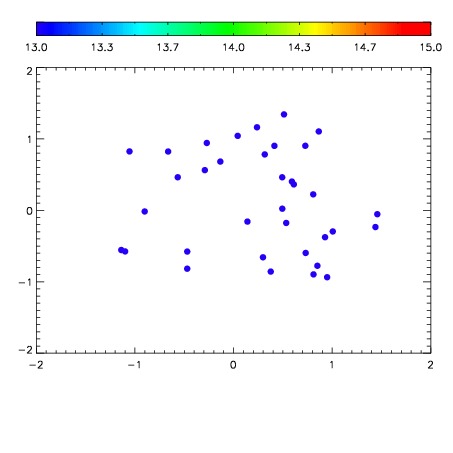

| Frame | Nreads | Zeropoints | Mag plots | Spatial mag deviation | Spatial sky 16325A emission deviations (filled: sky, open: star) | Spatial sky continuum emission | Spatial sky telluric CO2 absorption deviations (filled: H < 10) | |||||||||||||||||||||||
| 0 | 0 |
|
|
|
|
|
|
| IPAIR | NAME | SHIFT | NEWSHIFT | S/N | NAME | SHIFT | NEWSHIFT | S/N |
| 0 | 11830012 | 0.496821 | 0.00000 | 187.989 | 11830017 | -0.00229596 | 0.499117 | 188.066 |
| 1 | 11830015 | 0.492520 | 0.00430098 | 211.743 | 11830013 | -0.00228865 | 0.499110 | 207.147 |
| 2 | 11830016 | 0.492568 | 0.00425300 | 202.515 | 11830014 | -0.00189551 | 0.498717 | 199.528 |
| 3 | 11830011 | 0.495743 | 0.00107798 | 179.170 | 11830010 | 0.00000 | 0.496821 | 185.696 |