| Red | Green | Blue | |
| z | 17.64 | ||
| znorm | Inf | ||
| sky | -Inf | -Inf | -Inf |
| S/N | 21.3 | 37.8 | 40.1 |
| S/N(c) | 0.0 | 0.0 | 0.0 |
| SN(E/C) |

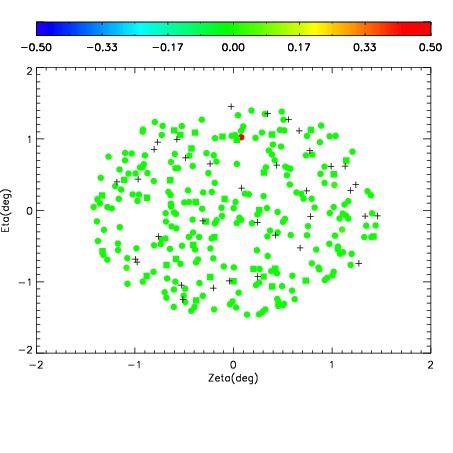
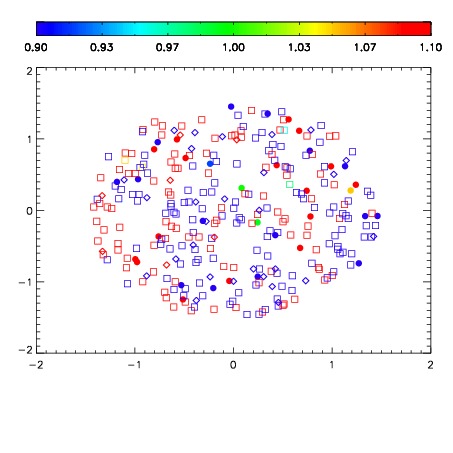
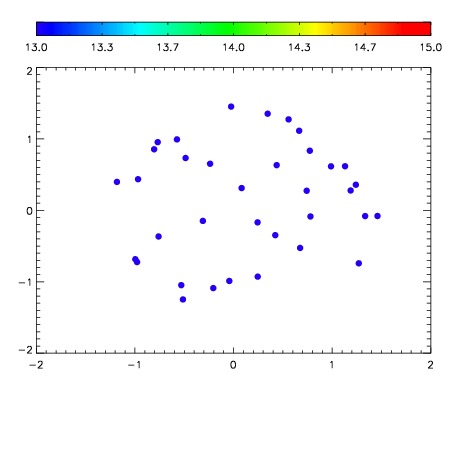

| Frame | Nreads | Zeropoints | Mag plots | Spatial mag deviation | Spatial sky 16325A emission deviations (filled: sky, open: star) | Spatial sky continuum emission | Spatial sky telluric CO2 absorption deviations (filled: H < 10) | |||||||||||||||||||||||
| 0 | 0 |
|
|
|
|
|
|
| IPAIR | NAME | SHIFT | NEWSHIFT | S/N | NAME | SHIFT | NEWSHIFT | S/N |
| 0 | 08690017 | 0.474532 | 0.00000 | 198.931 | 08690018 | -0.00338499 | 0.477917 | 213.387 |
| 1 | 08690013 | 0.471500 | 0.00303200 | 237.655 | 08690015 | 0.00139784 | 0.473134 | 234.065 |
| 2 | 08690012 | 0.470857 | 0.00367501 | 234.659 | 08690011 | 0.00000 | 0.474532 | 231.541 |
| 3 | 08690016 | 0.474366 | 0.000165999 | 226.959 | 08690014 | 0.00192411 | 0.472608 | 227.374 |