| Frame | Nreads | Zeropoints | Mag plots
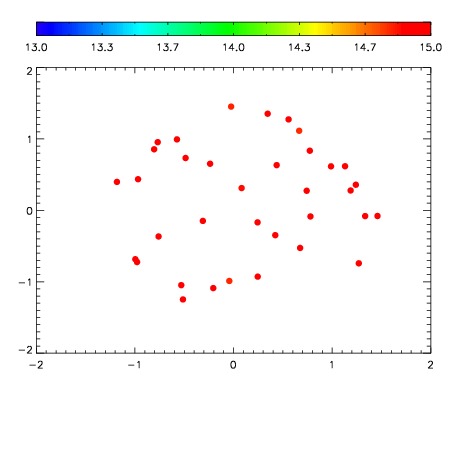
| Spatial mag deviation
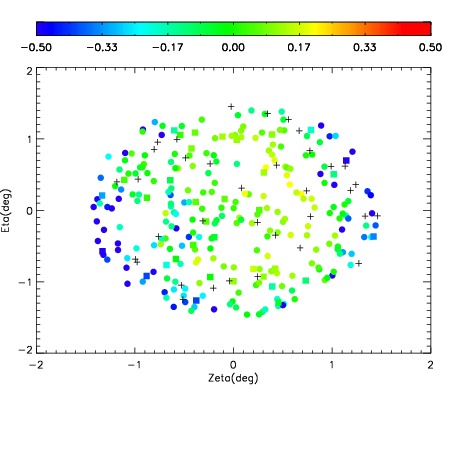
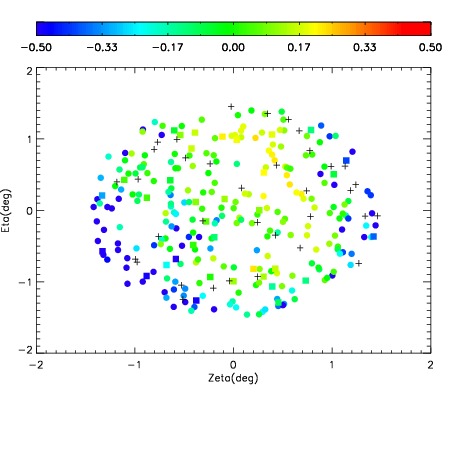
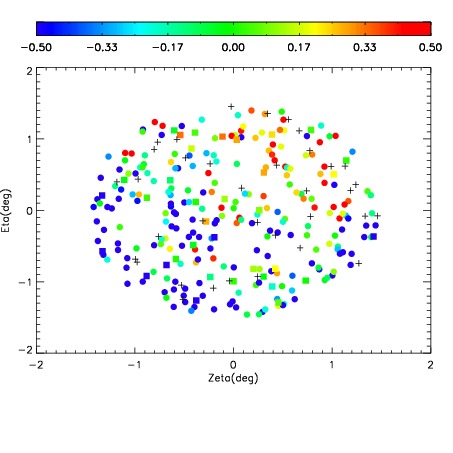
| Spatial sky 16325A emission deviations (filled: sky, open: star)
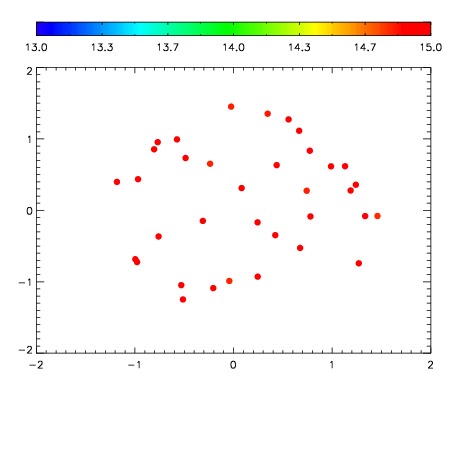
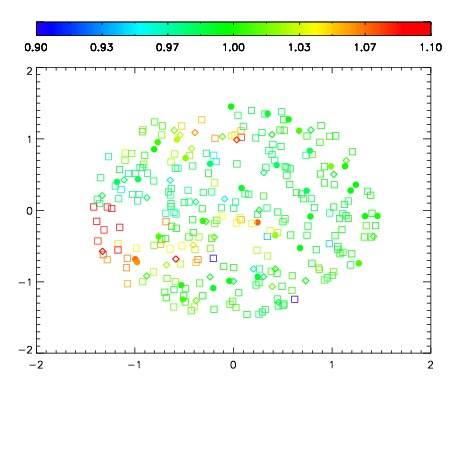
| Spatial sky continuum emission
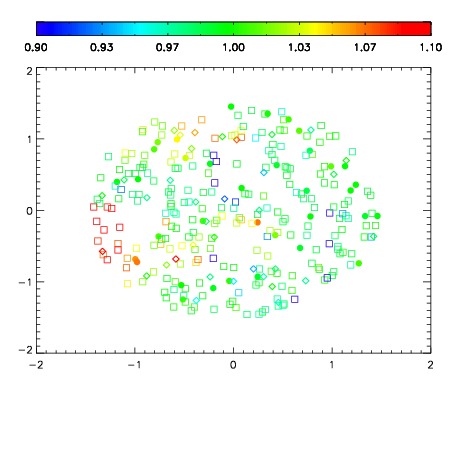
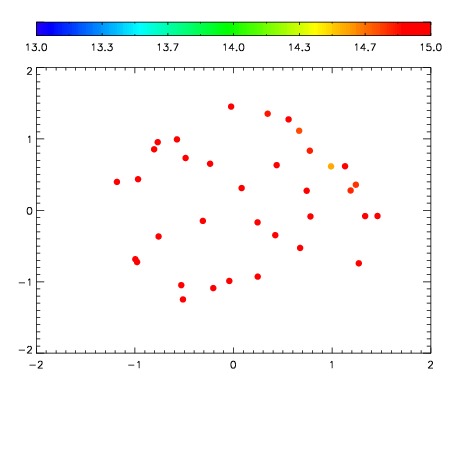
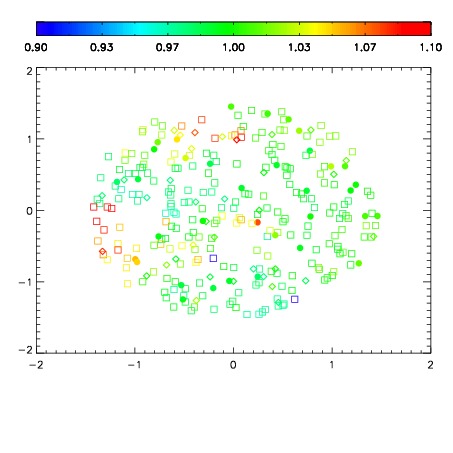
| Spatial sky telluric CO2 absorption deviations (filled: H < 10)
|
| 11620011
| 47
| | Red | Green | Blue
| | z | | 18.80
| | znorm | | 14.62
| | sky | 15.3 | 15.0 | 14.7
| | S/N | 10.9 | 18.5 | 19.7
| | S/N(c) | 9.1 | 16.7 | 18.3
| | SN(E/C) 0.38
|
| 
| 
| 
| 
| 
|
| 11620012
| 47
| | Red | Green | Blue
| | z | | 18.48
| | znorm | | 14.30
| | sky | 15.0 | 15.1 | 15.1
| | S/N | 7.9 | 15.4 | 15.4
| | S/N(c) | 6.9 | 13.2 | 14.3
| | SN(E/C) 0.41
|
| 
| 
| 
| 
| 
|
| 11620013
| 47
| | Red | Green | Blue
| | z | | 16.51
| | znorm | | 12.33
| | sky | 15.0 | 15.0 | 15.3
| | S/N | 1.4 | 4.0 | 3.4
| | S/N(c) | 0.0 | 0.0 | 0.0
| | SN(E/C) 0.58
|
| 
| 
| 
| 
| 
|
| 11620014
| 47
| | Red | Green | Blue
| | z | | 13.66
| | znorm | | 9.48
| | sky | 15.3 | 15.1 | 15.6
| | S/N | 0.1 | 0.2 | 0.3
| | S/N(c) | 0.0 | 0.0 | 0.0
| | SN(E/C) 1.04
|
| 
| 
| 
| 
| 
|