| Red | Green | Blue | |
| z | 17.64 | ||
| znorm | Inf | ||
| sky | -Inf | -Inf | -Inf |
| S/N | 23.6 | 40.6 | 42.7 |
| S/N(c) | 0.0 | 0.0 | 0.0 |
| SN(E/C) |
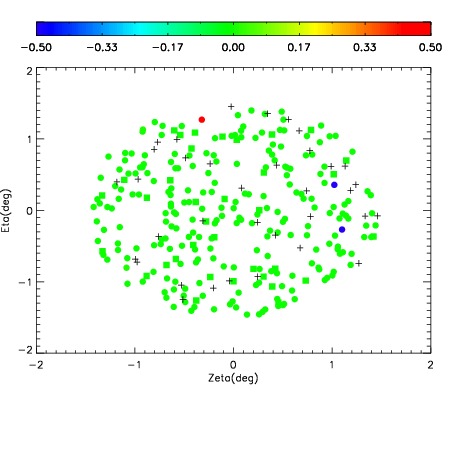
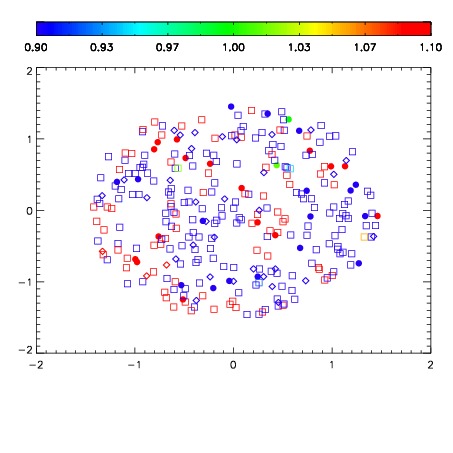
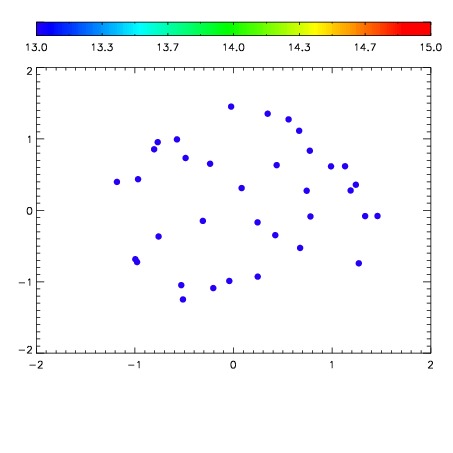

| Frame | Nreads | Zeropoints | Mag plots | Spatial mag deviation | Spatial sky 16325A emission deviations (filled: sky, open: star) | Spatial sky continuum emission | Spatial sky telluric CO2 absorption deviations (filled: H < 10) | |||||||||||||||||||||||
| 0 | 0 |
|
|
|
|
|
|
| IPAIR | NAME | SHIFT | NEWSHIFT | S/N | NAME | SHIFT | NEWSHIFT | S/N |
| 0 | 11710098 | 0.487909 | 0.00000 | 224.518 | 11710096 | -0.00208276 | 0.489992 | 224.542 |
| 1 | 11710094 | 0.485898 | 0.00201100 | 225.250 | 11710099 | -0.00220836 | 0.490117 | 225.209 |
| 2 | 11710097 | 0.487021 | 0.000887990 | 222.837 | 11710095 | -0.00194359 | 0.489853 | 222.561 |
| 3 | 11710093 | 0.485642 | 0.00226700 | 221.126 | 11710092 | 0.00000 | 0.487909 | 217.244 |