| Red | Green | Blue | |
| z | 17.64 | ||
| znorm | Inf | ||
| sky | -Inf | -Inf | -Inf |
| S/N | 22.6 | 38.8 | 45.5 |
| S/N(c) | 0.0 | 0.0 | 0.0 |
| SN(E/C) |
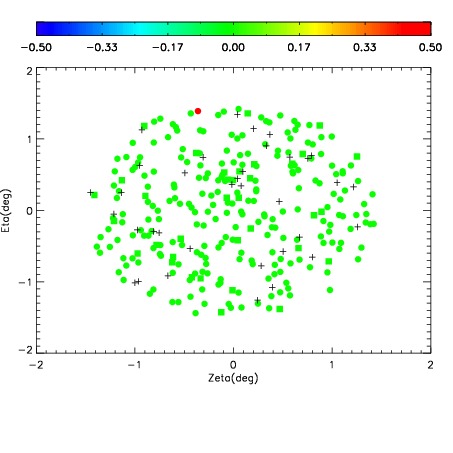
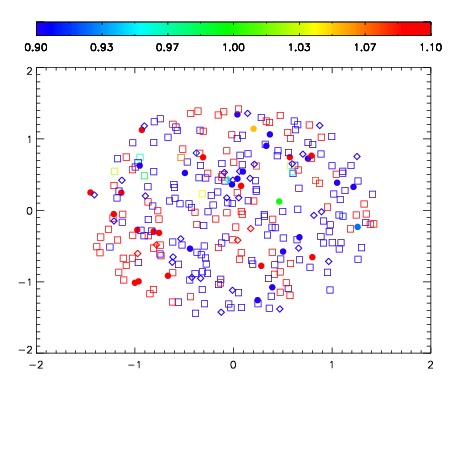
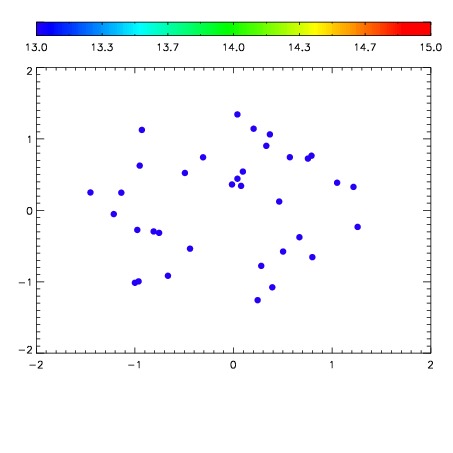

| Frame | Nreads | Zeropoints | Mag plots | Spatial mag deviation | Spatial sky 16325A emission deviations (filled: sky, open: star) | Spatial sky continuum emission | Spatial sky telluric CO2 absorption deviations (filled: H < 10) | |||||||||||||||||||||||
| 0 | 0 |
|
|
|
|
|
|
| IPAIR | NAME | SHIFT | NEWSHIFT | S/N | NAME | SHIFT | NEWSHIFT | S/N |
| 0 | 08460096 | 0.487980 | 0.00000 | 164.940 | 08460097 | 0.00393264 | 0.484047 | 163.901 |
| 1 | 08460099 | 0.483218 | 0.00476199 | 167.798 | 08460098 | 0.000885171 | 0.487095 | 165.503 |
| 2 | 08460100 | 0.484905 | 0.00307500 | 164.731 | 08460094 | 0.00000 | 0.487980 | 161.765 |
| 3 | 08460095 | 0.485087 | 0.00289300 | 160.607 | 08460101 | 0.00165159 | 0.486328 | 150.119 |