| Red | Green | Blue | |
| z | 17.64 | ||
| znorm | Inf | ||
| sky | -Inf | -Inf | -Inf |
| S/N | 13.1 | 25.8 | 27.9 |
| S/N(c) | 0.0 | 0.0 | 0.0 |
| SN(E/C) |
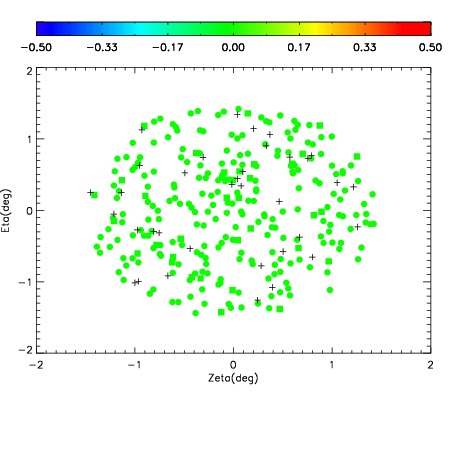
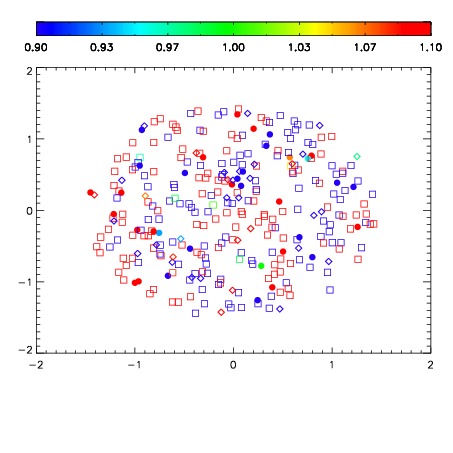
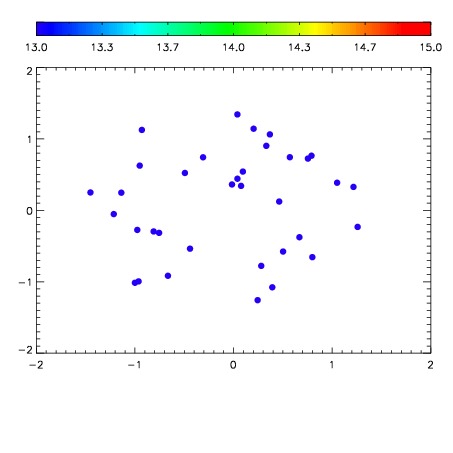

| Frame | Nreads | Zeropoints | Mag plots | Spatial mag deviation | Spatial sky 16325A emission deviations (filled: sky, open: star) | Spatial sky continuum emission | Spatial sky telluric CO2 absorption deviations (filled: H < 10) | |||||||||||||||||||||||
| 0 | 0 |
|
|
|
|
|
|
| IPAIR | NAME | SHIFT | NEWSHIFT | S/N | NAME | SHIFT | NEWSHIFT | S/N |
| 0 | 08710028 | 0.475660 | 0.00000 | 82.6698 | 08710025 | 0.00417435 | 0.471486 | 98.4335 |
| 1 | 08710023 | 0.474036 | 0.00162399 | 106.112 | 08710029 | 0.00334811 | 0.472312 | 113.831 |
| 2 | 08710027 | 0.475650 | 9.98378e-06 | 92.9626 | 08710026 | 0.00454543 | 0.471115 | 108.161 |
| 3 | 08710024 | 0.474867 | 0.000793010 | 92.8077 | 08710022 | 0.00000 | 0.475660 | 106.146 |