| Red | Green | Blue | |
| z | 17.64 | ||
| znorm | Inf | ||
| sky | -Inf | -NaN | -Inf |
| S/N | 25.1 | 45.7 | 47.8 |
| S/N(c) | 0.0 | 0.0 | 0.0 |
| SN(E/C) |

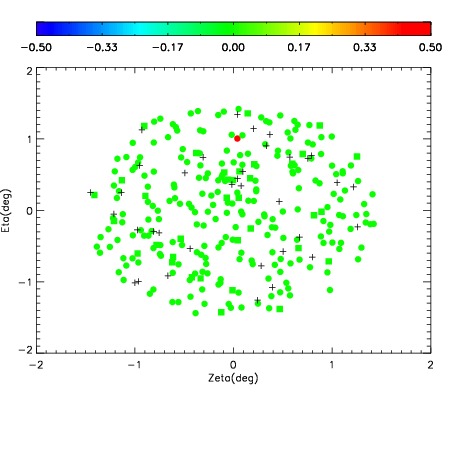
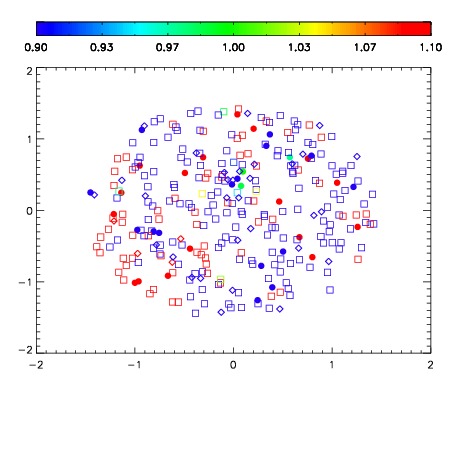
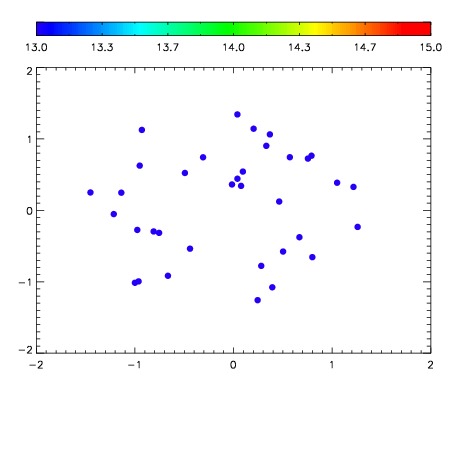

| Frame | Nreads | Zeropoints | Mag plots | Spatial mag deviation | Spatial sky 16325A emission deviations (filled: sky, open: star) | Spatial sky continuum emission | Spatial sky telluric CO2 absorption deviations (filled: H < 10) | |||||||||||||||||||||||
| 0 | 0 |
|
|
|
|
|
|
| IPAIR | NAME | SHIFT | NEWSHIFT | S/N | NAME | SHIFT | NEWSHIFT | S/N |
| 0 | 11600012 | 0.486576 | 0.00000 | 151.328 | 11600011 | 0.00000 | 0.486576 | 153.905 |
| 1 | 11600016 | 0.484972 | 0.00160399 | 162.010 | 11600018 | -0.00191001 | 0.488486 | 169.948 |
| 2 | 11600017 | 0.484528 | 0.00204799 | 159.768 | 11600015 | -0.00293749 | 0.489513 | 159.010 |
| 3 | 11600013 | 0.486293 | 0.000283003 | 156.903 | 11600014 | -0.00261629 | 0.489192 | 157.504 |