| Red | Green | Blue | |
| z | 17.64 | ||
| znorm | Inf | ||
| sky | -Inf | -Inf | -Inf |
| S/N | 27.6 | 49.6 | 53.2 |
| S/N(c) | 0.0 | 0.0 | 0.0 |
| SN(E/C) |
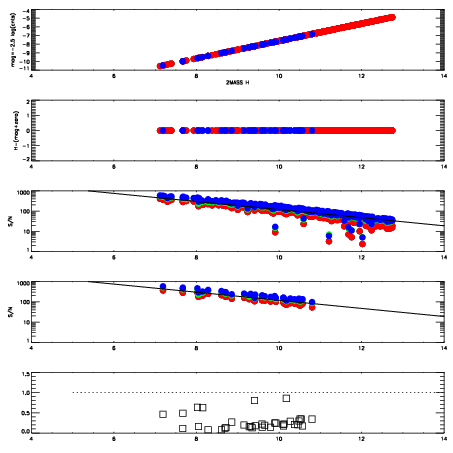
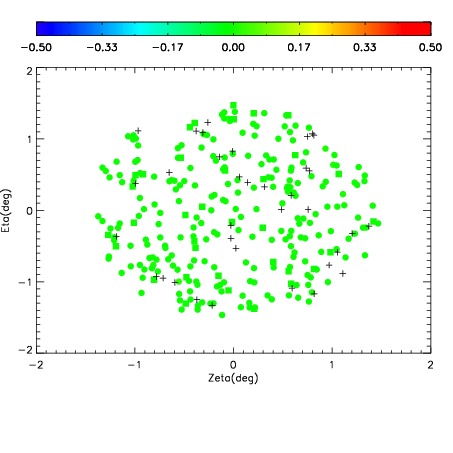
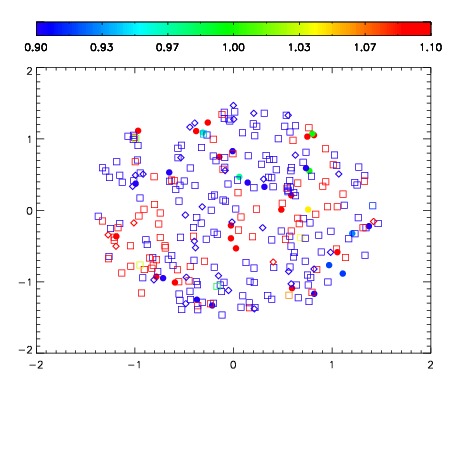
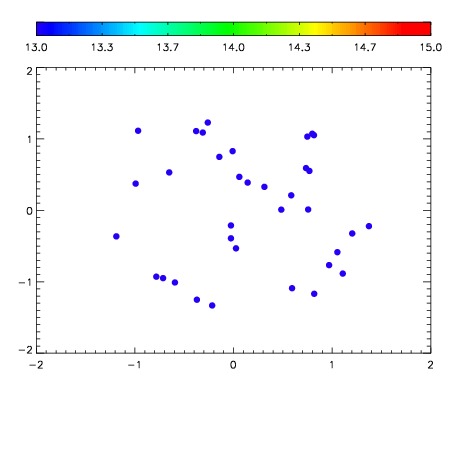

| Frame | Nreads | Zeropoints | Mag plots | Spatial mag deviation | Spatial sky 16325A emission deviations (filled: sky, open: star) | Spatial sky continuum emission | Spatial sky telluric CO2 absorption deviations (filled: H < 10) | |||||||||||||||||||||||
| 0 | 0 |
|
|
|
|
|
|
| IPAIR | NAME | SHIFT | NEWSHIFT | S/N | NAME | SHIFT | NEWSHIFT | S/N |
| 0 | 08490012 | 0.484158 | 0.00000 | 198.859 | 08490011 | 0.00000 | 0.484158 | 199.327 |
| 1 | 08490017 | 0.483814 | 0.000344008 | 206.775 | 08490018 | 0.00195859 | 0.482199 | 207.488 |
| 2 | 08490016 | 0.483856 | 0.000302017 | 204.278 | 08490015 | 0.000609739 | 0.483548 | 205.189 |
| 3 | 08490013 | 0.483965 | 0.000193000 | 199.306 | 08490014 | 0.000505156 | 0.483653 | 203.186 |