| Red | Green | Blue | |
| z | 17.64 | ||
| znorm | Inf | ||
| sky | -Inf | -Inf | -Inf |
| S/N | 17.0 | 32.1 | 33.1 |
| S/N(c) | 0.0 | 0.0 | 0.0 |
| SN(E/C) |
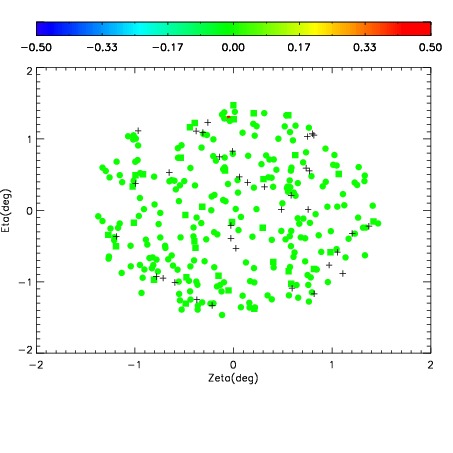
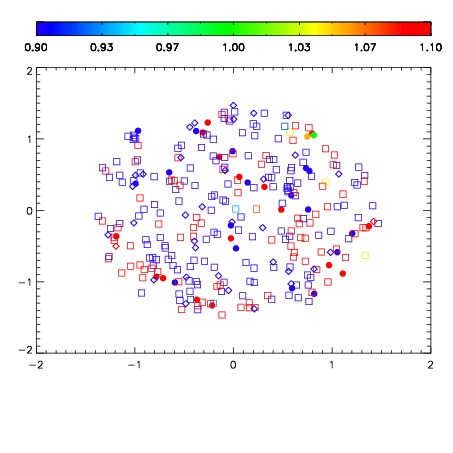
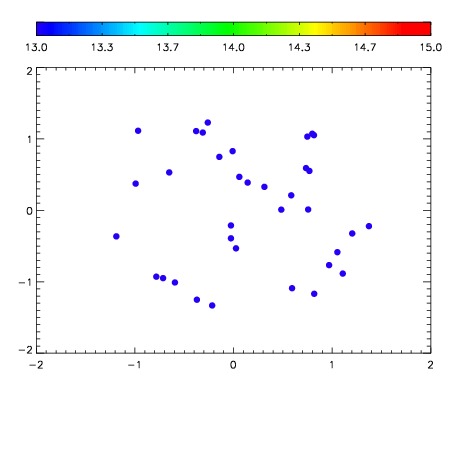

| Frame | Nreads | Zeropoints | Mag plots | Spatial mag deviation | Spatial sky 16325A emission deviations (filled: sky, open: star) | Spatial sky continuum emission | Spatial sky telluric CO2 absorption deviations (filled: H < 10) | |||||||||||||||||||||||
| 0 | 0 |
|
|
|
|
|
|
| IPAIR | NAME | SHIFT | NEWSHIFT | S/N | NAME | SHIFT | NEWSHIFT | S/N |
| 0 | 08710017 | 0.475902 | 0.00000 | 153.029 | 08710018 | 0.00214523 | 0.473757 | 149.644 |
| 1 | 08710016 | 0.474879 | 0.00102299 | 171.027 | 08710011 | 0.00000 | 0.475902 | 180.092 |
| 2 | 08710013 | 0.474377 | 0.00152498 | 164.639 | 08710014 | -0.000158825 | 0.476061 | 171.916 |
| 3 | 08710012 | 0.473683 | 0.00221899 | 161.854 | 08710015 | 0.000112769 | 0.475789 | 159.775 |