| Red | Green | Blue | |
| z | 17.64 | ||
| znorm | Inf | ||
| sky | -Inf | -Inf | -Inf |
| S/N | 26.9 | 46.2 | 51.7 |
| S/N(c) | 0.0 | 0.0 | 0.0 |
| SN(E/C) |
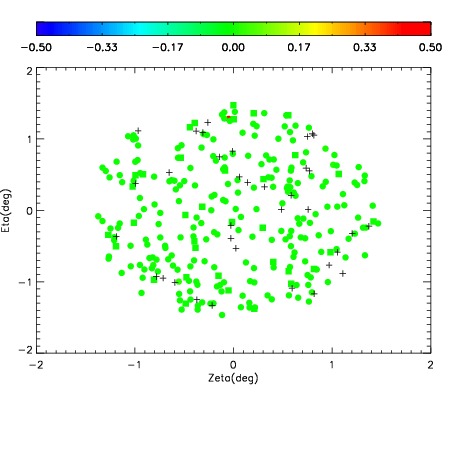
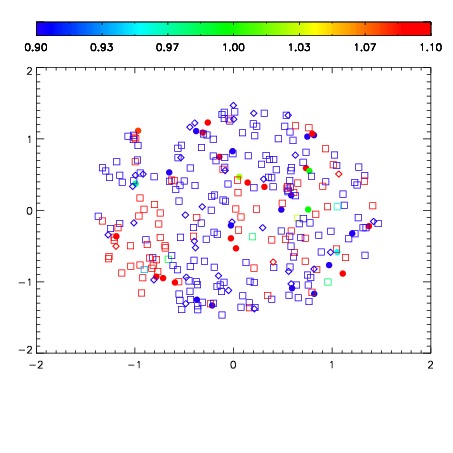
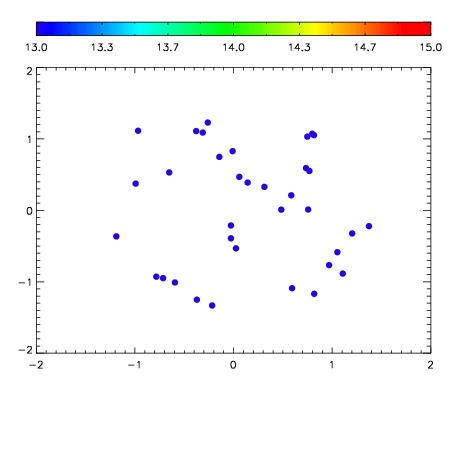

| Frame | Nreads | Zeropoints | Mag plots | Spatial mag deviation | Spatial sky 16325A emission deviations (filled: sky, open: star) | Spatial sky continuum emission | Spatial sky telluric CO2 absorption deviations (filled: H < 10) | |||||||||||||||||||||||
| 0 | 0 |
|
|
|
|
|
|
| IPAIR | NAME | SHIFT | NEWSHIFT | S/N | NAME | SHIFT | NEWSHIFT | S/N |
| 0 | 11450060 | 0.476728 | 0.00000 | 212.242 | 11450058 | -0.00147186 | 0.478200 | 212.875 |
| 1 | 11450061 | 0.476603 | 0.000124991 | 211.825 | 11450059 | -0.00213885 | 0.478867 | 212.429 |
| 2 | 11450057 | 0.475783 | 0.000945002 | 207.526 | 11450062 | -0.00138462 | 0.478113 | 210.790 |
| 3 | 11450056 | 0.475482 | 0.00124601 | 199.288 | 11450055 | 0.00000 | 0.476728 | 207.189 |