| Frame | Nreads | Zeropoints | Mag plots
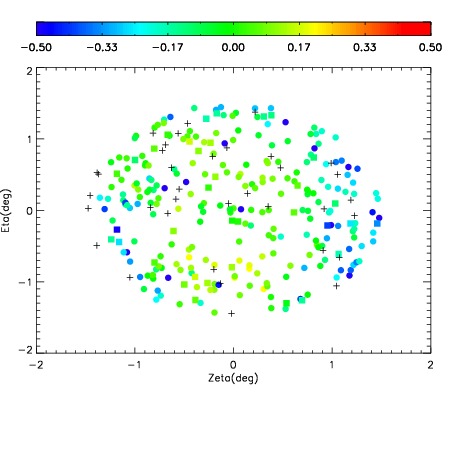
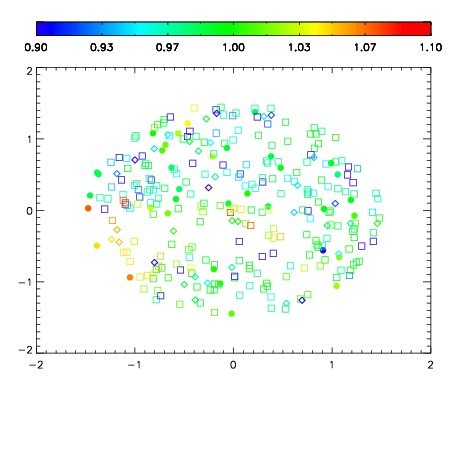
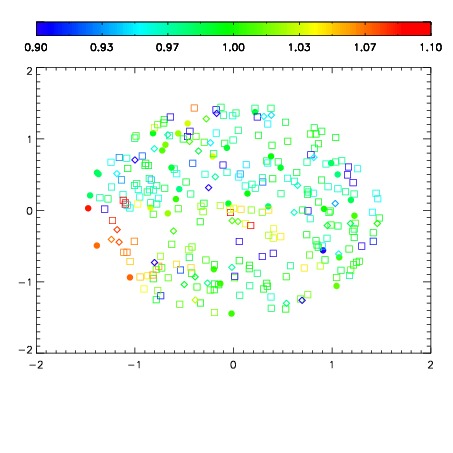
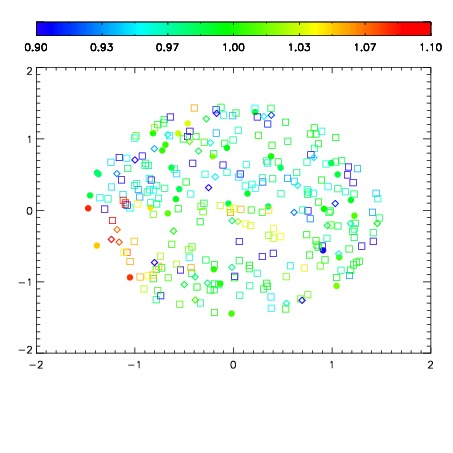
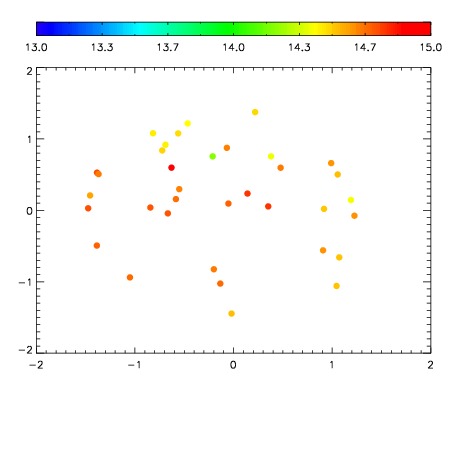
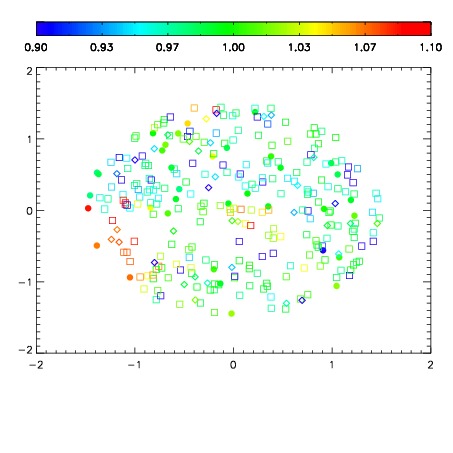
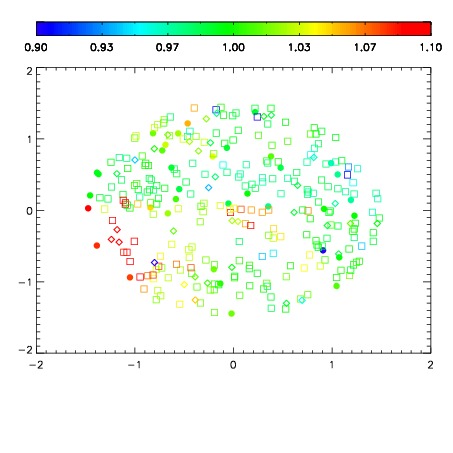
| Spatial mag deviation
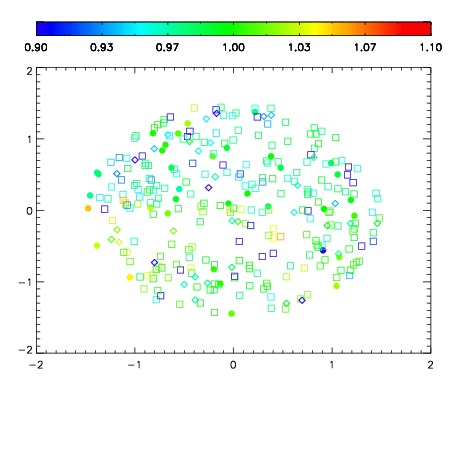
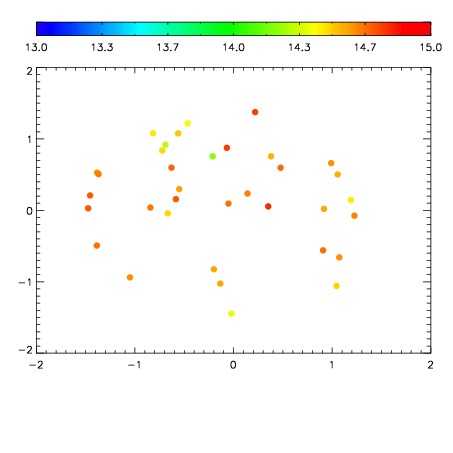
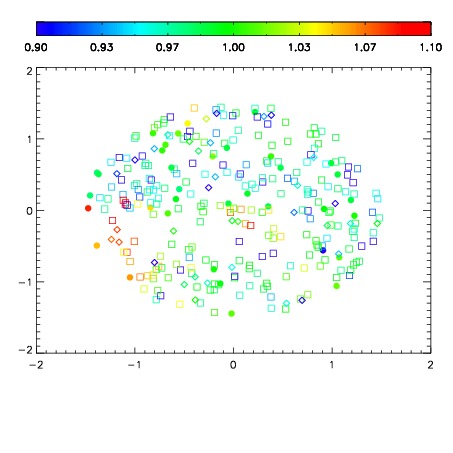
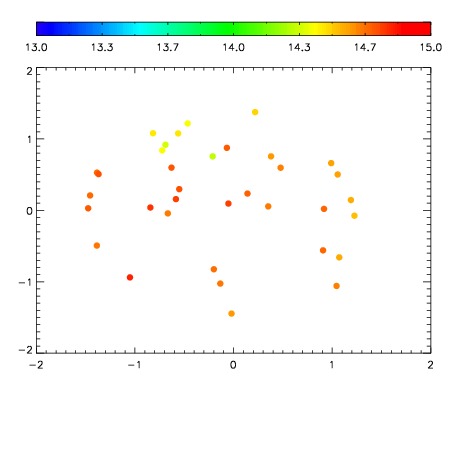
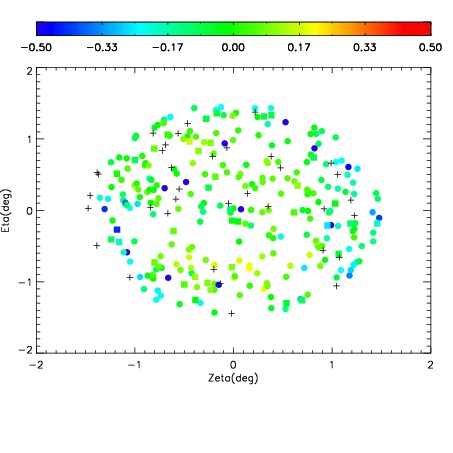
| Spatial sky 16325A emission deviations (filled: sky, open: star)
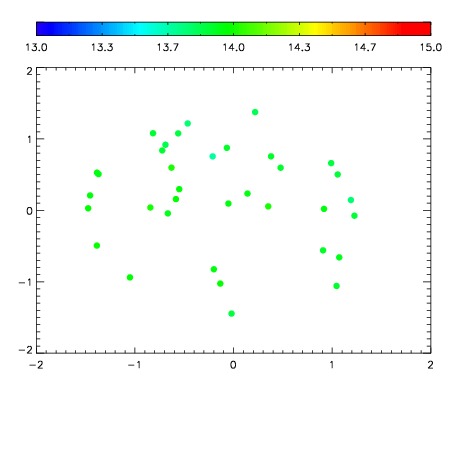
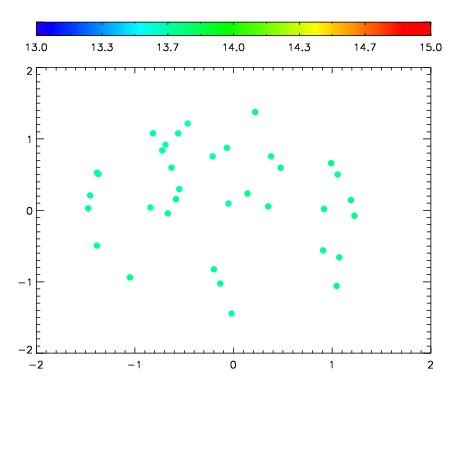
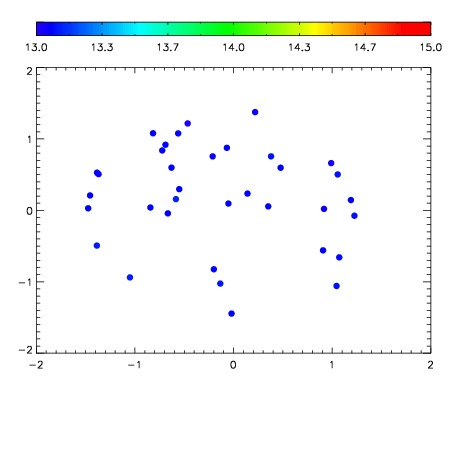
| Spatial sky continuum emission
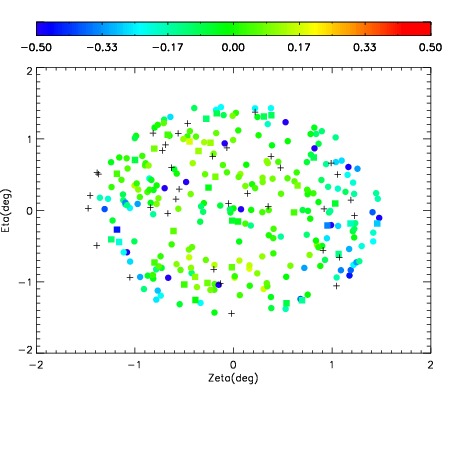
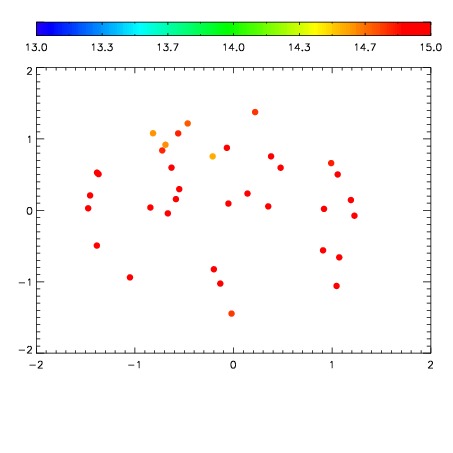
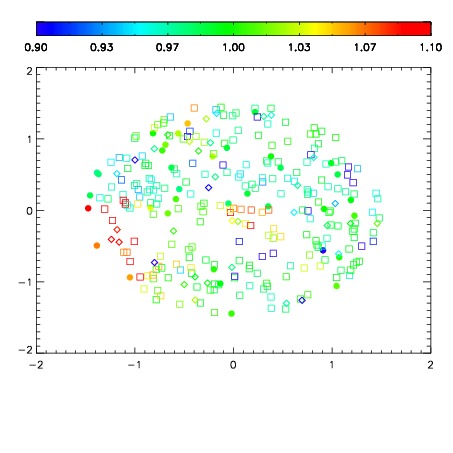
| Spatial sky telluric CO2 absorption deviations (filled: H < 10)
|
| 8180023
| 47
| | Red | Green | Blue
| | z | | 18.65
| | znorm | | 14.47
| | sky | 14.1 | 13.9 | 14.0
| | S/N | 11.8 | 20.1 | 20.9
| | S/N(c) | 10.2 | 18.4 | 19.8
| | SN(E/C) 0.53
|
| 
| 
| 
| 
| 
|
| 8180024
| 47
| | Red | Green | Blue
| | z | | 18.98
| | znorm | | 14.80
| | sky | 14.9 | 14.6 | 14.7
| | S/N | 14.9 | 24.8 | 26.0
| | S/N(c) | 13.3 | 23.2 | 24.9
| | SN(E/C) 0.49
|
| 
| 
| 
| 
| 
|
| 8180025
| 47
| | Red | Green | Blue
| | z | | 18.54
| | znorm | | 14.36
| | sky | 13.9 | 13.9 | 14.1
| | S/N | 10.7 | 18.7 | 19.9
| | S/N(c) | 9.2 | 17.1 | 18.5
| | SN(E/C) 0.55
|
| 
| 
| 
| 
| 
|
| 8180026
| 47
| | Red | Green | Blue
| | z | | 19.02
| | znorm | | 14.84
| | sky | 14.7 | 14.6 | 14.9
| | S/N | 15.2 | 25.6 | 26.7
| | S/N(c) | 13.6 | 23.9 | 25.6
| | SN(E/C) 0.46
|
| 
| 
| 
| 
| 
|
| 8180027
| 47
| | Red | Green | Blue
| | z | | 19.13
| | znorm | | 14.95
| | sky | 15.2 | 15.0 | 15.1
| | S/N | 16.7 | 27.5 | 28.6
| | S/N(c) | 15.0 | 25.9 | 27.5
| | SN(E/C) 0.46
|
| 
| 
| 
| 
| 
|
| 8180028
| 47
| | Red | Green | Blue
| | z | | 18.99
| | znorm | | 14.81
| | sky | 14.6 | 14.7 | 14.7
| | S/N | 14.9 | 25.2 | 26.2
| | S/N(c) | 13.1 | 23.6 | 25.1
| | SN(E/C) 0.45
|
| 
| 
| 
| 
| 
|
| 8180029
| 47
| | Red | Green | Blue
| | z | | 18.26
| | znorm | | 14.08
| | sky | 13.7 | 13.7 | 13.8
| | S/N | 8.4 | 15.2 | 16.5
| | S/N(c) | 7.3 | 13.8 | 15.2
| | SN(E/C) 0.62
|
| 
| 
| 
| 
| 
|
| 8180030
| 47
| | Red | Green | Blue
| | z | | 16.72
| | znorm | | 12.54
| | sky | 13.1 | 13.1 | 13.3
| | S/N | 2.0 | 4.2 | 5.0
| | S/N(c) | 1.8 | 3.8 | 4.5
| | SN(E/C) 0.89
|
| 
| 
| 
| 
| 
|

