| Red | Green | Blue | |
| z | 17.64 | ||
| znorm | Inf | ||
| sky | -Inf | -Inf | -Inf |
| S/N | 22.4 | 39.9 | 43.3 |
| S/N(c) | 0.0 | 0.0 | 0.0 |
| SN(E/C) |
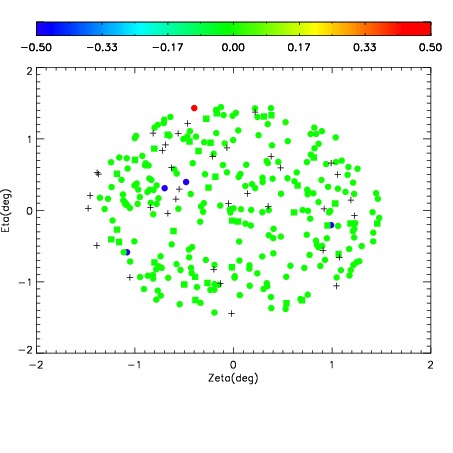
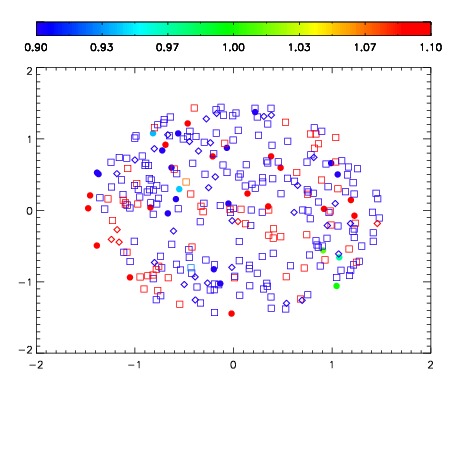
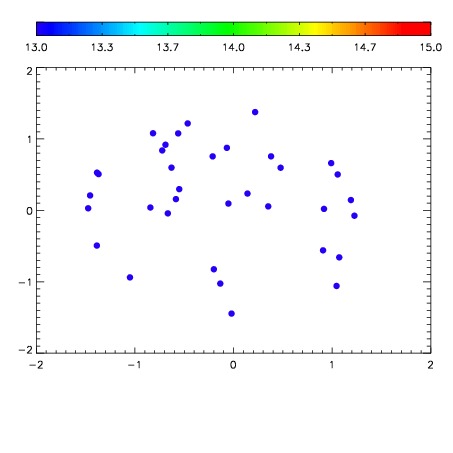

| Frame | Nreads | Zeropoints | Mag plots | Spatial mag deviation | Spatial sky 16325A emission deviations (filled: sky, open: star) | Spatial sky continuum emission | Spatial sky telluric CO2 absorption deviations (filled: H < 10) | |||||||||||||||||||||||
| 0 | 0 |
|
|
|
|
|
|
| IPAIR | NAME | SHIFT | NEWSHIFT | S/N | NAME | SHIFT | NEWSHIFT | S/N |
| 0 | 08180029 | 0.509562 | 0.00000 | 147.128 | 08180030 | -0.00147925 | 0.511041 | 69.5606 |
| 1 | 08180024 | 0.503058 | 0.00650400 | 203.718 | 08180027 | -0.00365168 | 0.513214 | 216.936 |
| 2 | 08180028 | 0.502180 | 0.00738204 | 203.540 | 08180026 | -0.00199277 | 0.511555 | 206.830 |
| 3 | 08180025 | 0.509481 | 8.10027e-05 | 167.732 | 08180023 | 0.00000 | 0.509562 | 175.899 |