| Red | Green | Blue | |
| z | 17.64 | ||
| znorm | Inf | ||
| sky | -Inf | -Inf | -Inf |
| S/N | 21.6 | 39.7 | 44.5 |
| S/N(c) | 0.0 | 0.0 | 0.0 |
| SN(E/C) |
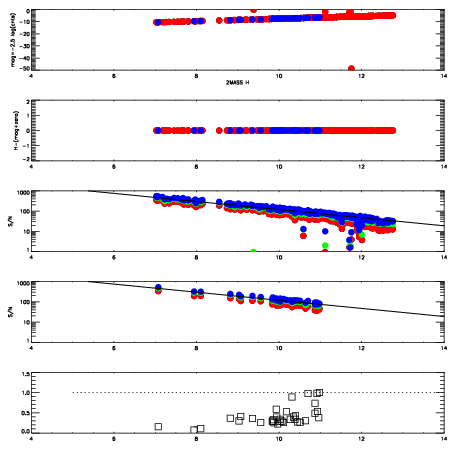
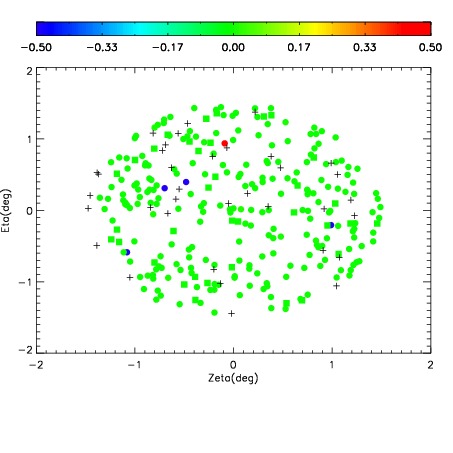
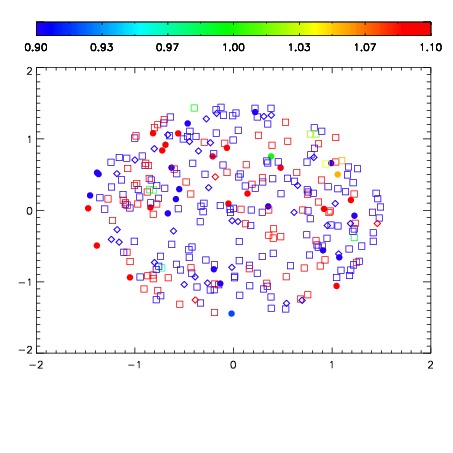


| Frame | Nreads | Zeropoints | Mag plots | Spatial mag deviation | Spatial sky 16325A emission deviations (filled: sky, open: star) | Spatial sky continuum emission | Spatial sky telluric CO2 absorption deviations (filled: H < 10) | |||||||||||||||||||||||
| 0 | 0 |
|
|
|
|
|
|
| IPAIR | NAME | SHIFT | NEWSHIFT | S/N | NAME | SHIFT | NEWSHIFT | S/N |
| 0 | 08430054 | 0.487368 | 0.00000 | 173.020 | 08430055 | -0.000425745 | 0.487794 | 163.309 |
| 1 | 08430050 | 0.486070 | 0.00129798 | 201.239 | 08430052 | -0.000831021 | 0.488199 | 203.041 |
| 2 | 08430049 | 0.486230 | 0.00113800 | 188.033 | 08430048 | 0.00000 | 0.487368 | 194.683 |
| 3 | 08430053 | 0.485976 | 0.00139198 | 185.579 | 08430051 | 0.00444578 | 0.482922 | 178.756 |