| Red | Green | Blue | |
| z | 17.64 | ||
| znorm | Inf | ||
| sky | -NaN | -NaN | -Inf |
| S/N | 25.8 | 45.3 | 49.4 |
| S/N(c) | 0.0 | 0.0 | 0.0 |
| SN(E/C) |
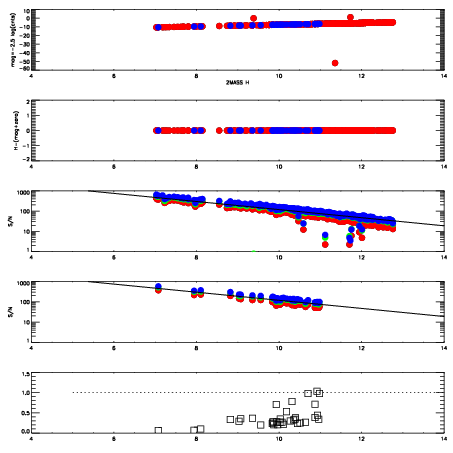
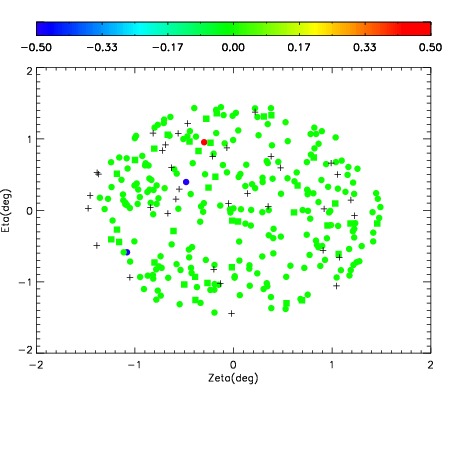
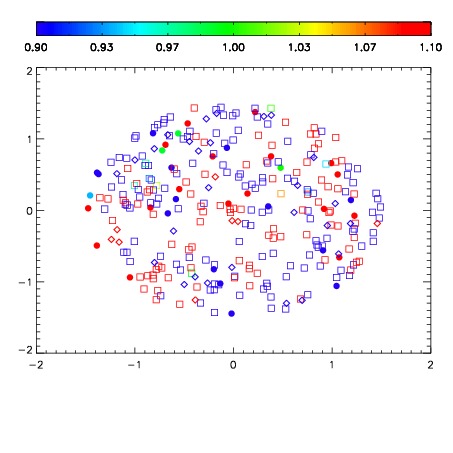
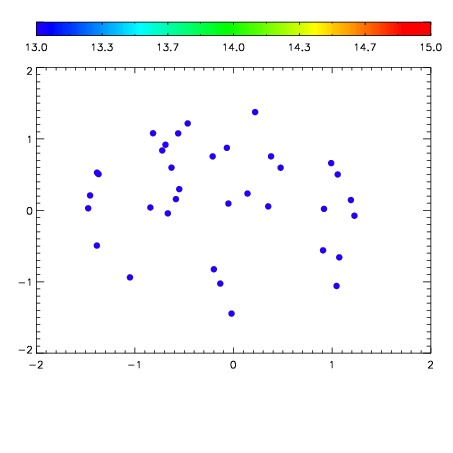

| Frame | Nreads | Zeropoints | Mag plots | Spatial mag deviation | Spatial sky 16325A emission deviations (filled: sky, open: star) | Spatial sky continuum emission | Spatial sky telluric CO2 absorption deviations (filled: H < 10) | |||||||||||||||||||||||
| 0 | 0 |
|
|
|
|
|
|
| IPAIR | NAME | SHIFT | NEWSHIFT | S/N | NAME | SHIFT | NEWSHIFT | S/N |
| 0 | 08500031 | 0.490164 | 0.00000 | 214.138 | 08500033 | 0.000657548 | 0.489506 | 213.347 |
| 1 | 08500030 | 0.489415 | 0.000749022 | 217.937 | 08500032 | 0.00134878 | 0.488815 | 218.169 |
| 2 | 08500034 | 0.486097 | 0.00406700 | 217.768 | 08500029 | 0.00000 | 0.490164 | 215.532 |
| 3 | 08500035 | 0.486613 | 0.00355101 | 212.957 | 08500036 | 0.00271273 | 0.487451 | 211.835 |