| Red | Green | Blue | |
| z | 17.64 | ||
| znorm | Inf | ||
| sky | -Inf | -Inf | -Inf |
| S/N | 27.5 | 48.1 | 52.8 |
| S/N(c) | 0.0 | 0.0 | 0.0 |
| SN(E/C) |

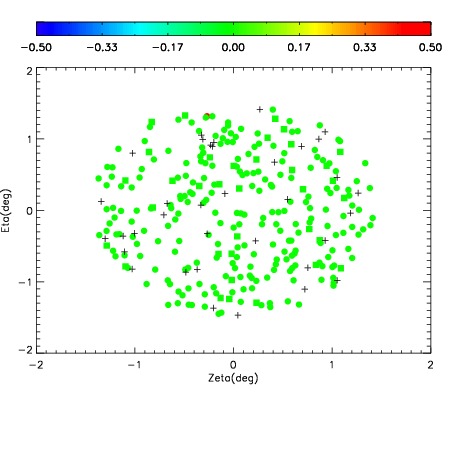
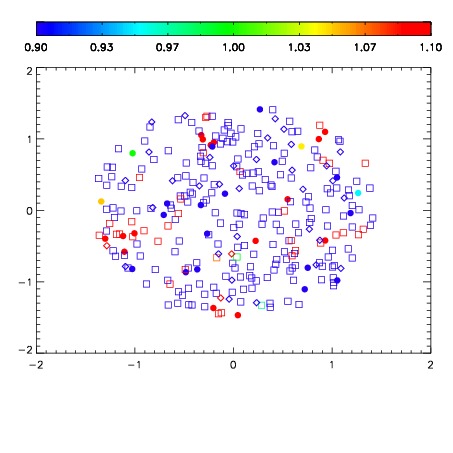
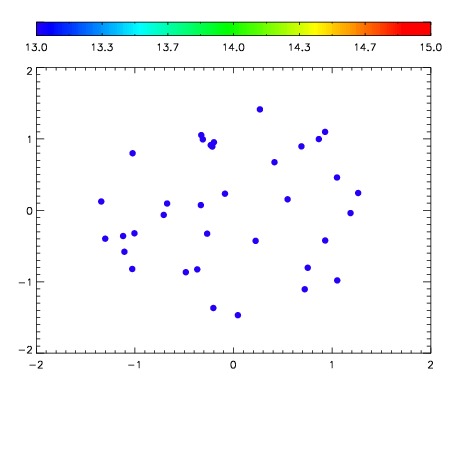

| Frame | Nreads | Zeropoints | Mag plots | Spatial mag deviation | Spatial sky 16325A emission deviations (filled: sky, open: star) | Spatial sky continuum emission | Spatial sky telluric CO2 absorption deviations (filled: H < 10) | |||||||||||||||||||||||
| 0 | 0 |
|
|
|
|
|
|
| IPAIR | NAME | SHIFT | NEWSHIFT | S/N | NAME | SHIFT | NEWSHIFT | S/N |
| 0 | 08440053 | 0.481888 | 0.00000 | 220.998 | 08440050 | 0.00466429 | 0.477224 | 217.648 |
| 1 | 08440048 | 0.481685 | 0.000202984 | 219.396 | 08440047 | 0.00000 | 0.481888 | 217.513 |
| 2 | 08440049 | 0.481365 | 0.000523001 | 219.043 | 08440051 | 0.00125988 | 0.480628 | 216.089 |
| 3 | 08440052 | 0.480338 | 0.00154999 | 217.726 | 08440054 | 0.00457276 | 0.477315 | 211.248 |