| Red | Green | Blue | |
| z | 17.64 | ||
| znorm | Inf | ||
| sky | -NaN | -Inf | -Inf |
| S/N | 24.5 | 45.2 | 48.1 |
| S/N(c) | 0.0 | 0.0 | 0.0 |
| SN(E/C) |
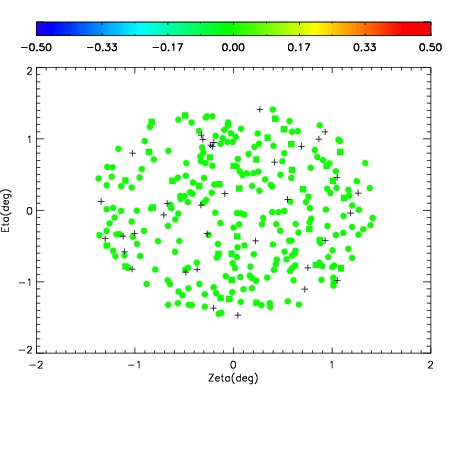
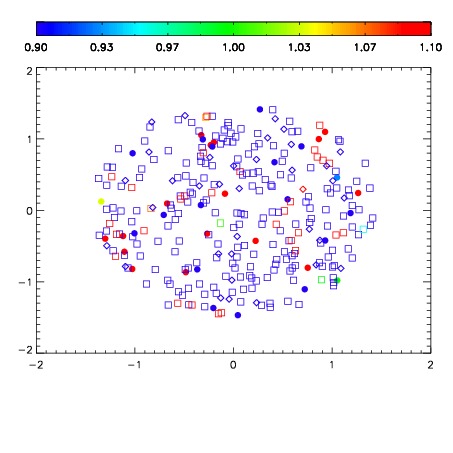
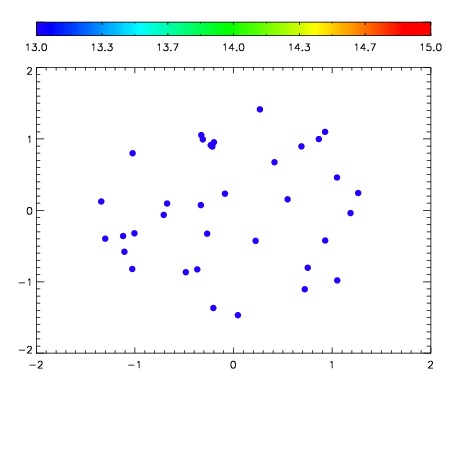

| Frame | Nreads | Zeropoints | Mag plots | Spatial mag deviation | Spatial sky 16325A emission deviations (filled: sky, open: star) | Spatial sky continuum emission | Spatial sky telluric CO2 absorption deviations (filled: H < 10) | |||||||||||||||||||||||
| 0 | 0 |
|
|
|
|
|
|
| IPAIR | NAME | SHIFT | NEWSHIFT | S/N | NAME | SHIFT | NEWSHIFT | S/N |
| 0 | 08510030 | 0.482854 | 0.00000 | 213.526 | 08510029 | 0.00000 | 0.482854 | 217.039 |
| 1 | 08510035 | 0.480144 | 0.00271001 | 224.952 | 08510036 | 0.00145715 | 0.481397 | 225.369 |
| 2 | 08510031 | 0.482507 | 0.000347018 | 216.911 | 08510032 | 0.00318213 | 0.479672 | 220.571 |
| 3 | 08510034 | 0.480578 | 0.00227600 | 213.710 | 08510033 | 0.00162730 | 0.481227 | 218.620 |