| Red | Green | Blue | |
| z | 17.64 | ||
| znorm | Inf | ||
| sky | -Inf | -Inf | -Inf |
| S/N | 26.6 | 48.1 | 52.4 |
| S/N(c) | 0.0 | 0.0 | 0.0 |
| SN(E/C) |
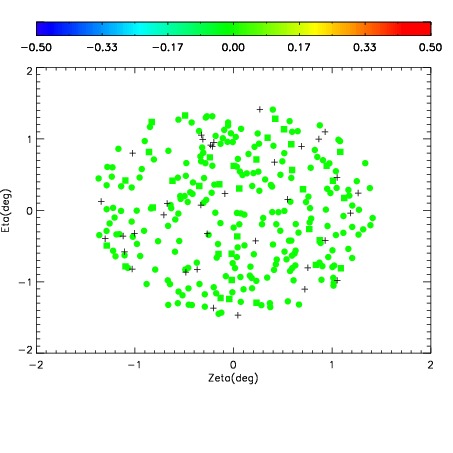
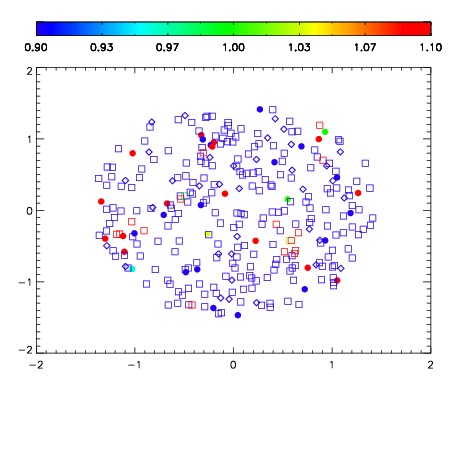
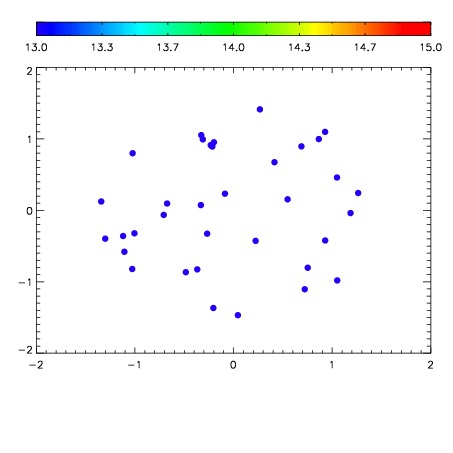

| Frame | Nreads | Zeropoints | Mag plots | Spatial mag deviation | Spatial sky 16325A emission deviations (filled: sky, open: star) | Spatial sky continuum emission | Spatial sky telluric CO2 absorption deviations (filled: H < 10) | |||||||||||||||||||||||
| 0 | 0 |
|
|
|
|
|
|
| IPAIR | NAME | SHIFT | NEWSHIFT | S/N | NAME | SHIFT | NEWSHIFT | S/N |
| 0 | 08700050 | 0.470992 | 0.00000 | 202.318 | 08700055 | -0.000489099 | 0.471481 | 204.151 |
| 1 | 08700057 | 0.468226 | 0.00276601 | 216.168 | 08700056 | -0.00118266 | 0.472175 | 209.763 |
| 2 | 08700054 | 0.469277 | 0.00171500 | 203.968 | 08700051 | -0.00106862 | 0.472061 | 206.109 |
| 3 | 08700053 | 0.470230 | 0.000761986 | 203.596 | 08700052 | -0.00202749 | 0.473019 | 205.428 |
| 4 | 08700049 | 0.470845 | 0.000146985 | 196.550 | 08700048 | 0.00000 | 0.470992 | 202.260 |