| Red | Green | Blue | |
| z | 17.64 | ||
| znorm | Inf | ||
| sky | -NaN | -Inf | -Inf |
| S/N | 25.6 | 44.9 | 48.2 |
| S/N(c) | 0.0 | 0.0 | 0.0 |
| SN(E/C) |
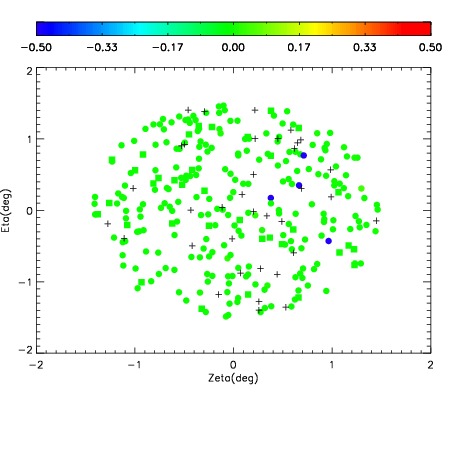
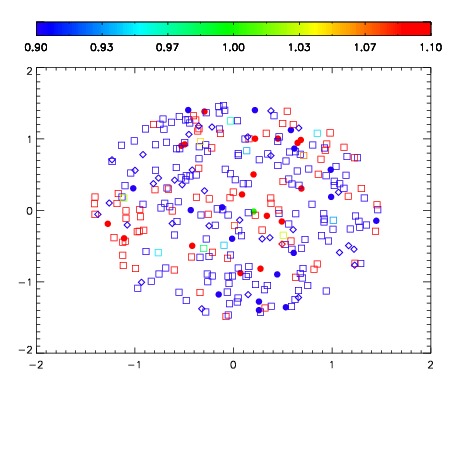
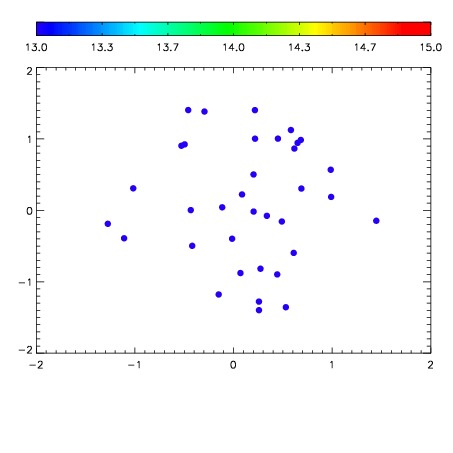

| Frame | Nreads | Zeropoints | Mag plots | Spatial mag deviation | Spatial sky 16325A emission deviations (filled: sky, open: star) | Spatial sky continuum emission | Spatial sky telluric CO2 absorption deviations (filled: H < 10) | |||||||||||||||||||||||
| 0 | 0 |
|
|
|
|
|
|
| IPAIR | NAME | SHIFT | NEWSHIFT | S/N | NAME | SHIFT | NEWSHIFT | S/N |
| 0 | 08180036 | 0.510315 | 0.00000 | 172.794 | 08180034 | 0.00000 | 0.510315 | 93.3250 |
| 1 | 08180039 | 0.505543 | 0.00477201 | 206.113 | 08180038 | -0.00322121 | 0.513536 | 211.121 |
| 2 | 08180040 | 0.510100 | 0.000214994 | 203.746 | 08180041 | -0.00129528 | 0.511610 | 207.565 |
| 3 | 08180035 | 0.505143 | 0.00517201 | 199.487 | 08180037 | -0.00146961 | 0.511785 | 198.135 |