| Red | Green | Blue | |
| z | 17.64 | ||
| znorm | Inf | ||
| sky | -Inf | -Inf | -Inf |
| S/N | 22.8 | 39.1 | 43.7 |
| S/N(c) | 0.0 | 0.0 | 0.0 |
| SN(E/C) |
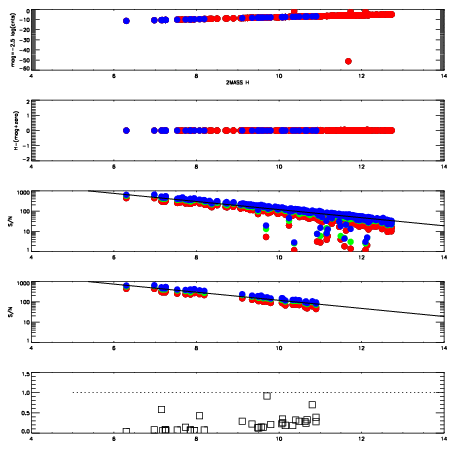
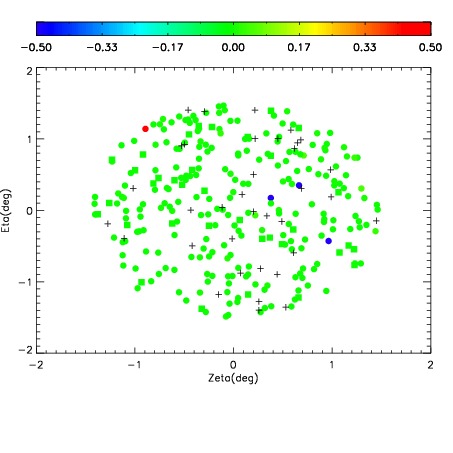

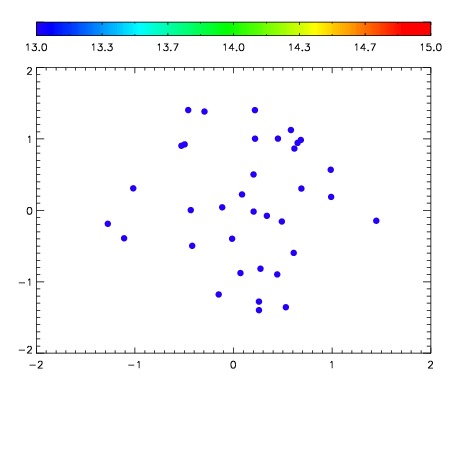

| Frame | Nreads | Zeropoints | Mag plots | Spatial mag deviation | Spatial sky 16325A emission deviations (filled: sky, open: star) | Spatial sky continuum emission | Spatial sky telluric CO2 absorption deviations (filled: H < 10) | |||||||||||||||||||||||
| 0 | 0 |
|
|
|
|
|
|
| IPAIR | NAME | SHIFT | NEWSHIFT | S/N | NAME | SHIFT | NEWSHIFT | S/N |
| 0 | 08430039 | 0.490287 | 0.00000 | 190.072 | 08430044 | 0.00248179 | 0.487805 | 178.690 |
| 1 | 08430038 | 0.489945 | 0.000342011 | 197.898 | 08430037 | 0.00000 | 0.490287 | 195.294 |
| 2 | 08430043 | 0.487070 | 0.00321701 | 182.506 | 08430041 | 0.00241161 | 0.487875 | 162.614 |
| 3 | 08430042 | 0.487130 | 0.00315702 | 174.879 | 08430040 | 0.00403303 | 0.486254 | 152.356 |