| Red | Green | Blue | |
| z | 17.64 | ||
| znorm | Inf | ||
| sky | -Inf | -Inf | -Inf |
| S/N | 24.0 | 43.5 | 47.5 |
| S/N(c) | 0.0 | 0.0 | 0.0 |
| SN(E/C) |
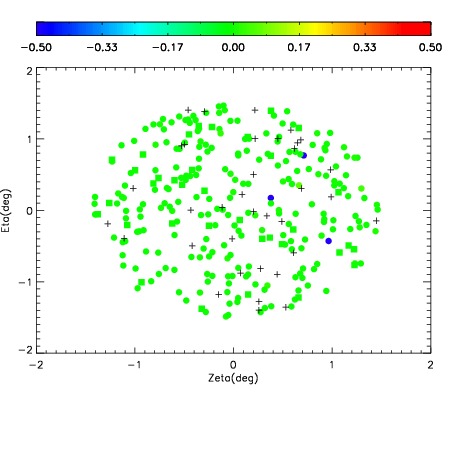
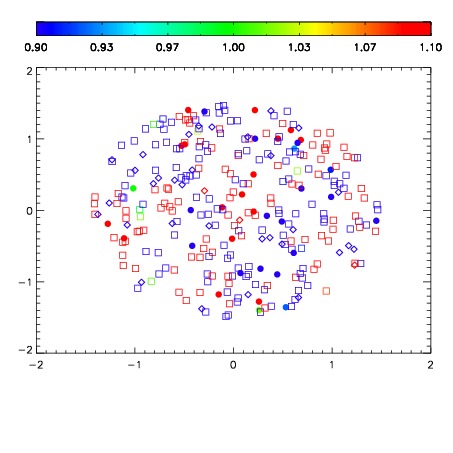
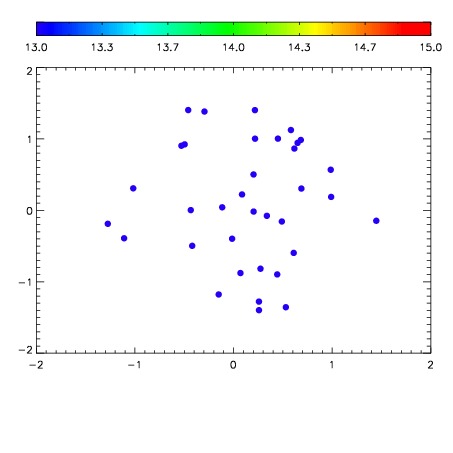

| Frame | Nreads | Zeropoints | Mag plots | Spatial mag deviation | Spatial sky 16325A emission deviations (filled: sky, open: star) | Spatial sky continuum emission | Spatial sky telluric CO2 absorption deviations (filled: H < 10) | |||||||||||||||||||||||
| 0 | 0 |
|
|
|
|
|
|
| IPAIR | NAME | SHIFT | NEWSHIFT | S/N | NAME | SHIFT | NEWSHIFT | S/N |
| 0 | 08500046 | 0.487583 | 0.00000 | 206.740 | 08500044 | 0.00000 | 0.487583 | 202.790 |
| 1 | 08500050 | 0.486225 | 0.00135800 | 214.913 | 08500051 | 0.00192978 | 0.485653 | 210.407 |
| 2 | 08500045 | 0.487582 | 1.01328e-06 | 210.639 | 08500048 | -0.000159507 | 0.487743 | 210.158 |
| 3 | 08500049 | 0.486187 | 0.00139600 | 208.530 | 08500047 | 0.00117412 | 0.486409 | 205.166 |