| Red | Green | Blue | |
| z | 17.64 | ||
| znorm | Inf | ||
| sky | -Inf | -Inf | -Inf |
| S/N | 24.8 | 42.5 | 46.6 |
| S/N(c) | 0.0 | 0.0 | 0.0 |
| SN(E/C) |

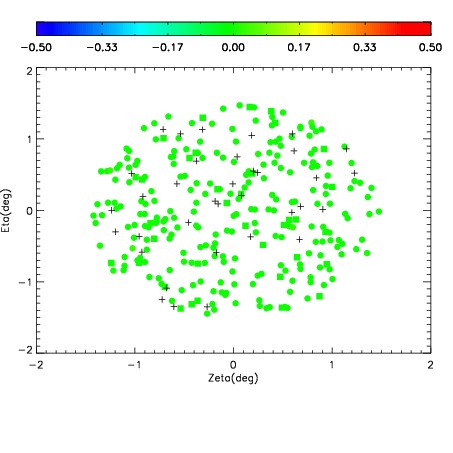
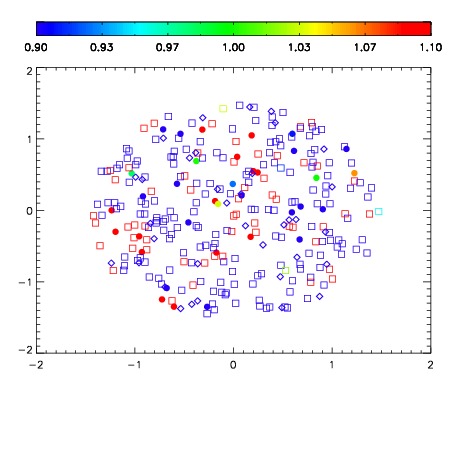
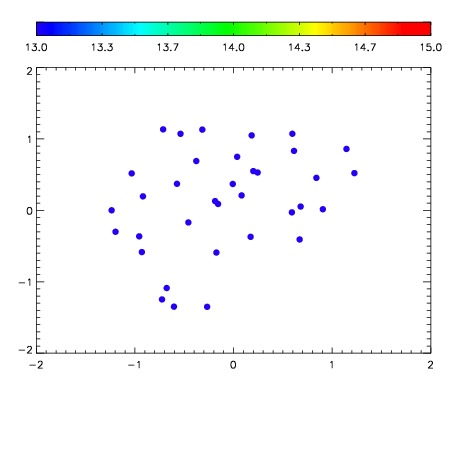

| Frame | Nreads | Zeropoints | Mag plots | Spatial mag deviation | Spatial sky 16325A emission deviations (filled: sky, open: star) | Spatial sky continuum emission | Spatial sky telluric CO2 absorption deviations (filled: H < 10) | |||||||||||||||||||||||
| 0 | 0 |
|
|
|
|
|
|
| IPAIR | NAME | SHIFT | NEWSHIFT | S/N | NAME | SHIFT | NEWSHIFT | S/N |
| 0 | 08160031 | 0.508802 | 0.00000 | 205.885 | 08160029 | -0.00174340 | 0.510545 | 206.650 |
| 1 | 08160030 | 0.496825 | 0.0119770 | 203.703 | 08160032 | -0.00352874 | 0.512331 | 204.435 |
| 2 | 08160027 | 0.506470 | 0.00233197 | 200.212 | 08160028 | -0.00264978 | 0.511452 | 201.080 |
| 3 | 08160026 | 0.500698 | 0.00810403 | 194.630 | 08160025 | 0.00000 | 0.508802 | 193.490 |