| Red | Green | Blue | |
| z | 17.64 | ||
| znorm | Inf | ||
| sky | -Inf | -Inf | -Inf |
| S/N | 18.5 | 33.1 | 39.4 |
| S/N(c) | 0.0 | 0.0 | 0.0 |
| SN(E/C) |
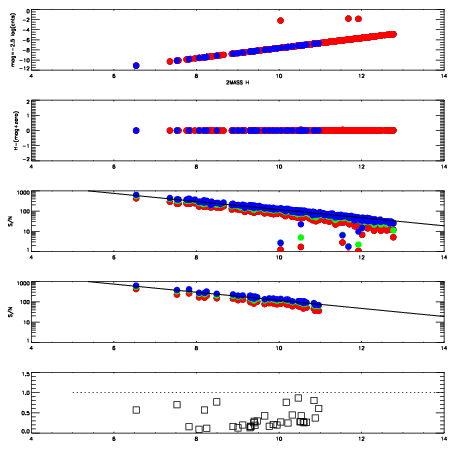
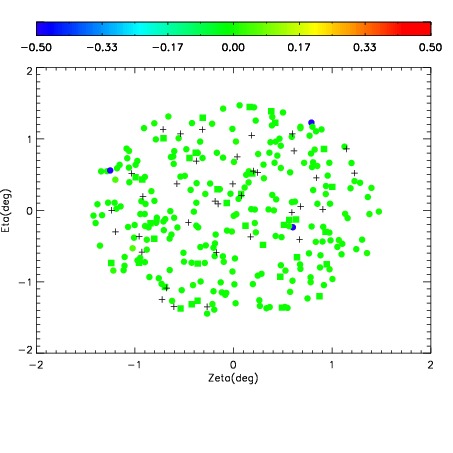
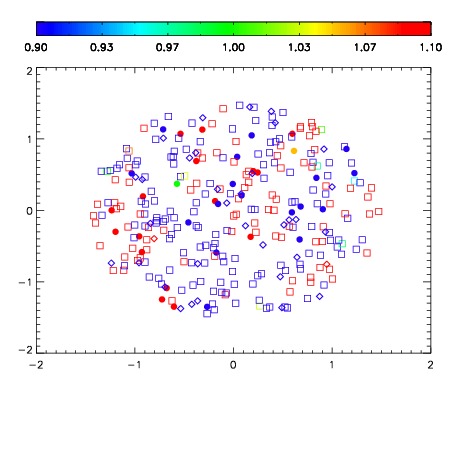
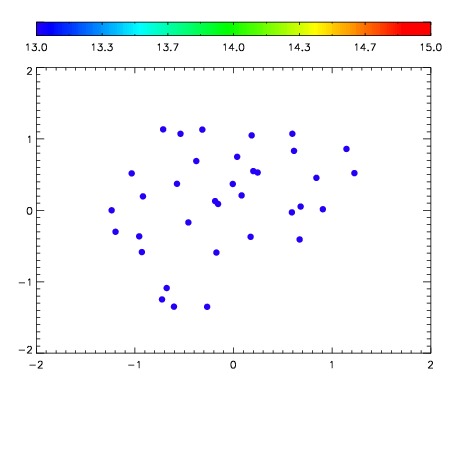

| Frame | Nreads | Zeropoints | Mag plots | Spatial mag deviation | Spatial sky 16325A emission deviations (filled: sky, open: star) | Spatial sky continuum emission | Spatial sky telluric CO2 absorption deviations (filled: H < 10) | |||||||||||||||||||||||
| 0 | 0 |
|
|
|
|
|
|
| IPAIR | NAME | SHIFT | NEWSHIFT | S/N | NAME | SHIFT | NEWSHIFT | S/N |
| 0 | 08430061 | 0.493042 | 0.00000 | 176.228 | 08430066 | 0.00559996 | 0.487442 | 182.957 |
| 1 | 08430065 | 0.488970 | 0.00407198 | 174.575 | 08430059 | 0.00000 | 0.493042 | 174.215 |
| 2 | 08430060 | 0.492924 | 0.000117987 | 159.839 | 08430063 | 0.00480816 | 0.488234 | 157.534 |
| 3 | 08430064 | 0.489100 | 0.00394198 | 146.219 | 08430062 | 0.00413583 | 0.488906 | 139.316 |