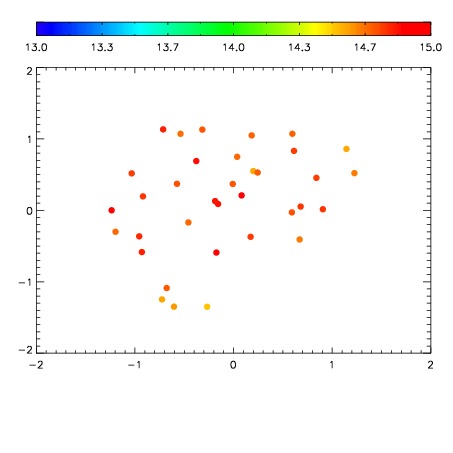
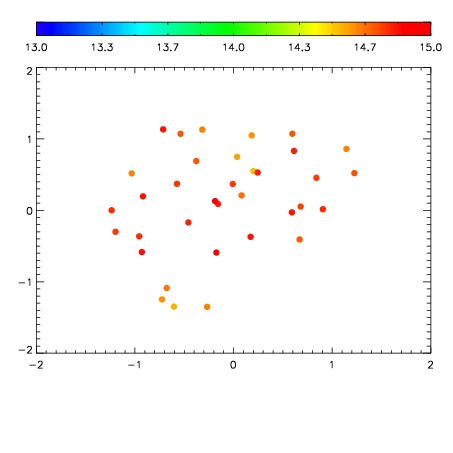
| Frame | Nreads | Zeropoints | Mag plots
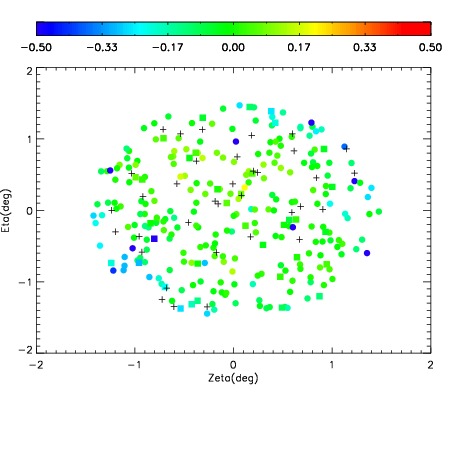
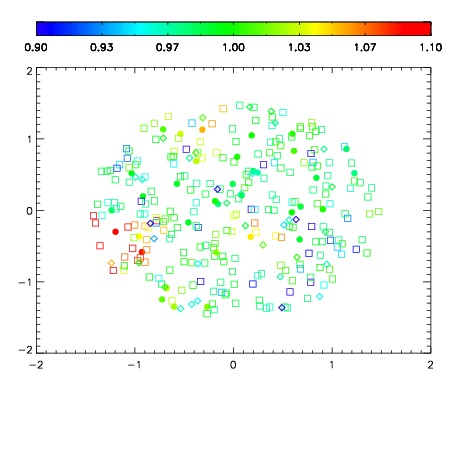
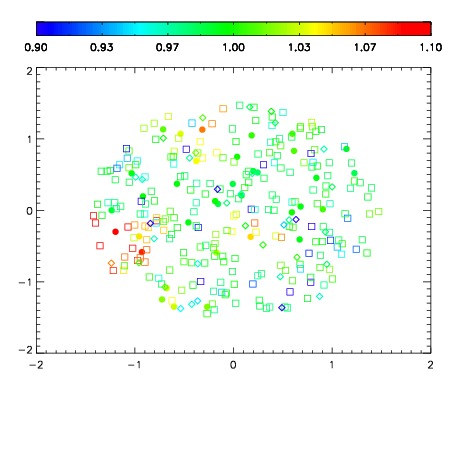
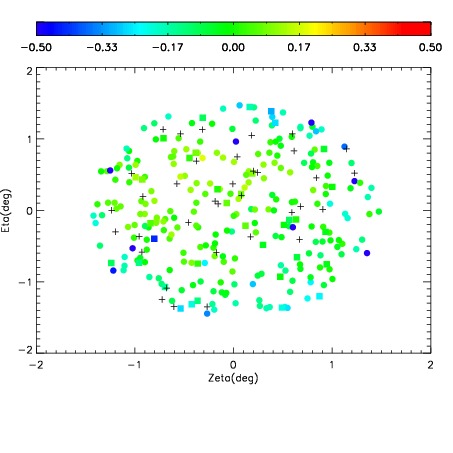
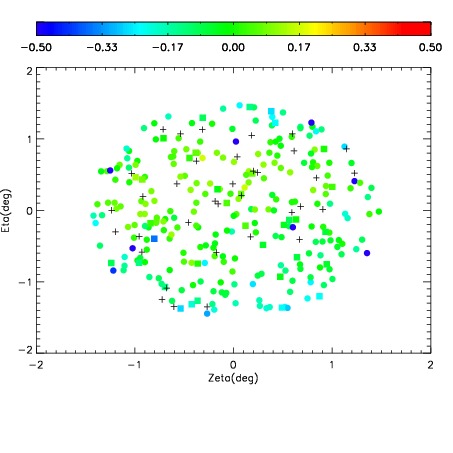
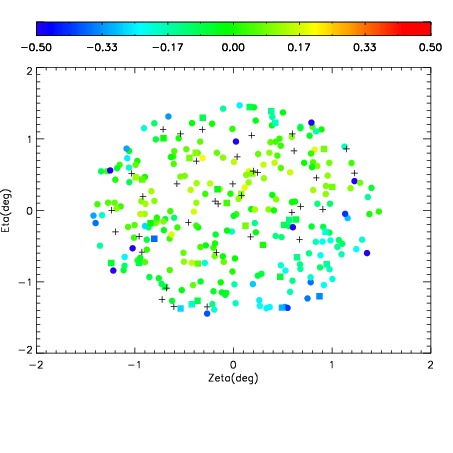
| Spatial mag deviation
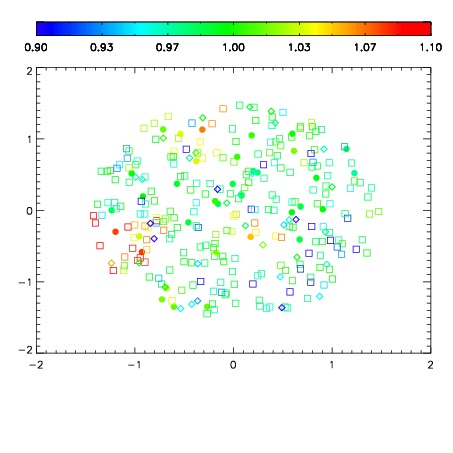
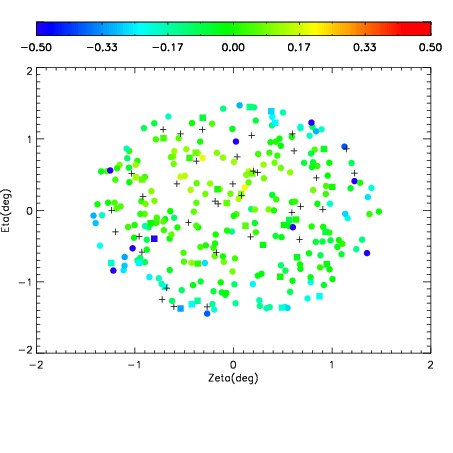
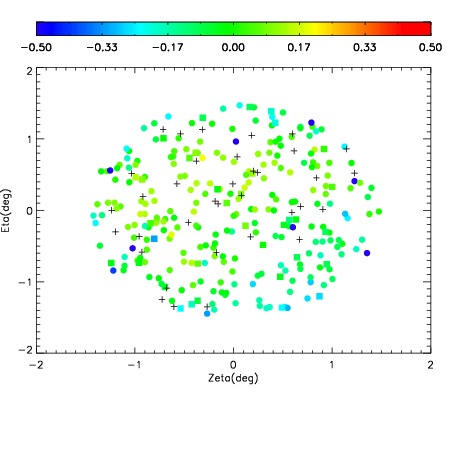
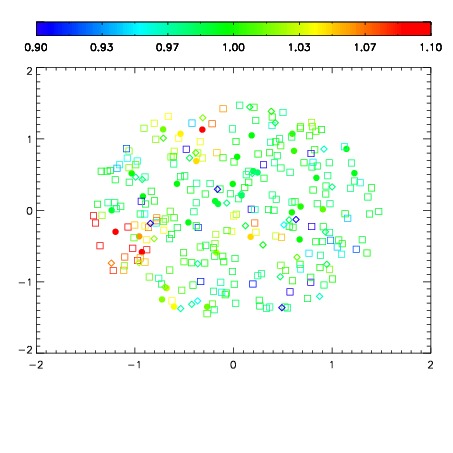
| Spatial sky 16325A emission deviations (filled: sky, open: star)
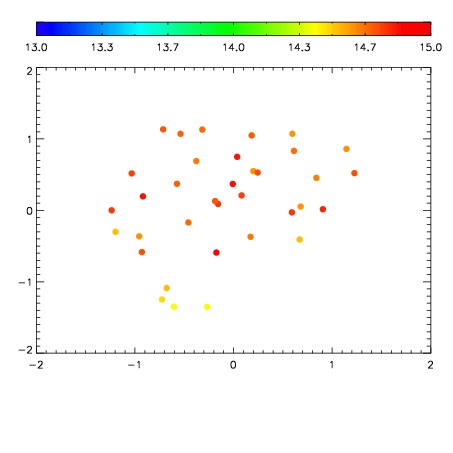
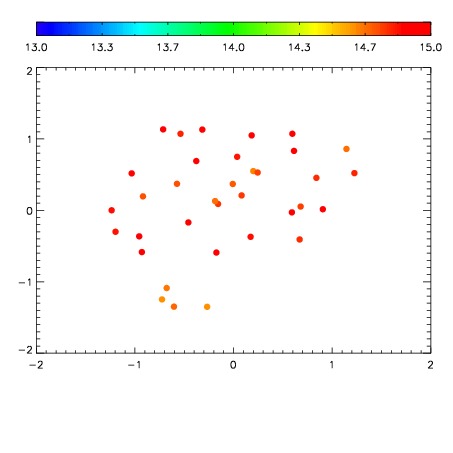
| Spatial sky continuum emission
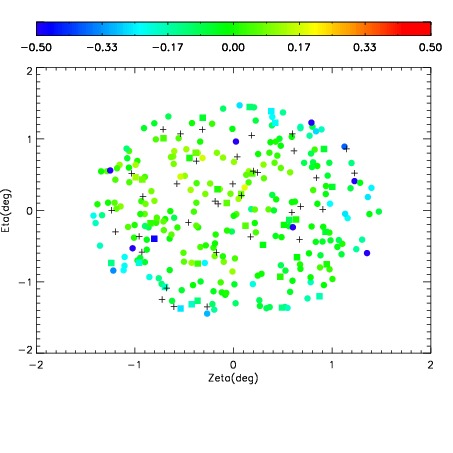
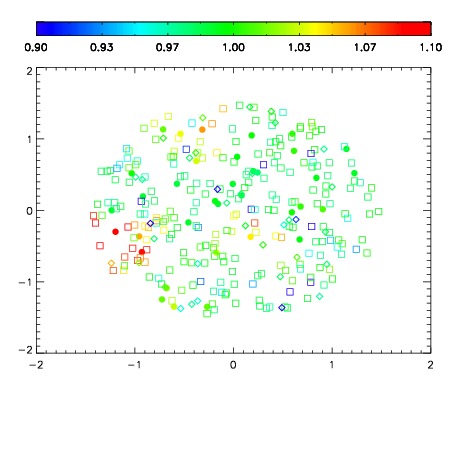
| Spatial sky telluric CO2 absorption deviations (filled: H < 10)
|
| 8470071
| 47
| | Red | Green | Blue
| | z | | 18.51
| | znorm | | 14.33
| | sky | 15.2 | 14.8 | 14.8
| | S/N | 10.0 | 17.8 | 19.6
| | S/N(c) | 8.5 | 16.2 | 18.2
| | SN(E/C) 0.42
|
| 
| 
| 
| 
| 
|
| 8470072
| 47
| | Red | Green | Blue
| | z | | 18.50
| | znorm | | 14.32
| | sky | 14.9 | 14.7 | 15.1
| | S/N | 9.9 | 17.7 | 19.8
| | S/N(c) | 8.5 | 16.2 | 18.1
| | SN(E/C) 0.45
|
| 
| 
| 
| 
| 
|
| 8470073
| 47
| | Red | Green | Blue
| | z | | 18.50
| | znorm | | 14.32
| | sky | 15.0 | 14.8 | 15.3
| | S/N | 9.7 | 17.5 | 19.5
| | S/N(c) | 8.5 | 16.2 | 17.6
| | SN(E/C) 0.45
|
| 
| 
| 
| 
| 
|
| 8470074
| 47
| | Red | Green | Blue
| | z | | 18.66
| | znorm | | 14.48
| | sky | 15.2 | 14.7 | 15.1
| | S/N | 10.9 | 19.3 | 21.5
| | S/N(c) | 9.7 | 17.8 | 19.3
| | SN(E/C) 0.39
|
| 
| 
| 
| 
| 
|
| 8470075
| 47
| | Red | Green | Blue
| | z | | 18.46
| | znorm | | 14.28
| | sky | 14.9 | 14.7 | 15.1
| | S/N | 9.4 | 17.4 | 18.3
| | S/N(c) | 8.1 | 15.8 | 16.7
| | SN(E/C) 0.42
|
| 
| 
| 
| 
| 
|
| 8470076
| 47
| | Red | Green | Blue
| | z | | 18.33
| | znorm | | 14.14
| | sky | 15.1 | 14.8 | 15.2
| | S/N | 8.4 | 15.9 | 17.0
| | S/N(c) | 7.3 | 14.5 | 15.3
| | SN(E/C) 0.46
|
| 
| 
| 
| 
| 
|
| 8470077
| 47
| | Red | Green | Blue
| | z | | 18.34
| | znorm | | 14.16
| | sky | 14.9 | 14.8 | 15.2
| | S/N | 8.8 | 16.2 | 17.4
| | S/N(c) | 7.7 | 14.7 | 15.5
| | SN(E/C) 0.44
|
| 
| 
| 
| 
| 
|
| 8470078
| 47
| | Red | Green | Blue
| | z | | 18.57
| | znorm | | 14.39
| | sky | 14.9 | 14.8 | 15.2
| | S/N | 10.4 | 18.3 | 19.5
| | S/N(c) | 8.9 | 16.6 | 18.0
| | SN(E/C) 0.40
|
| 
| 
| 
| 
| 
|